-
Groundwater Sustainability in a Humid Climate: Groundwater Pumping, Groundwater Consumption, and Land-Use Change
Open-file report; contains unpublished data that has not yet been peer-reviewed. -
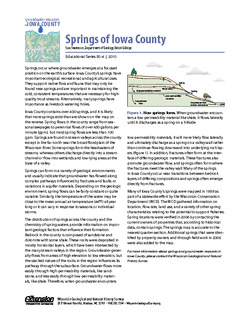
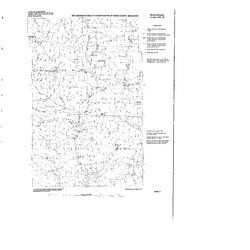
Groundwater Resources in Iowa County
This four-part series describes the results of a comprehensive inventory and assessment of Iowa County's groundwater resources. Covers water-table elevation, groundwater recharge, groundwater susceptibility, and the springs of Iowa County. -
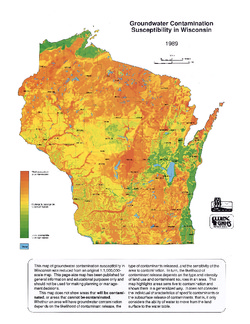
Groundwater Contamination Susceptibility in Wisconsin
How susceptible are different areas of Wisconsin to groundwater contamination? This map gives a quick visual overview. It was created using type of bedrock, depth to bedrock, depth to water table, soil type, and surface deposits. -
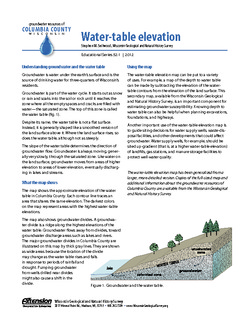
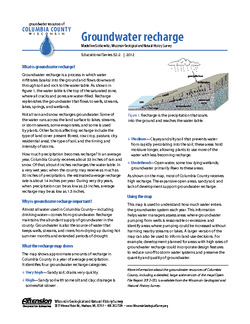
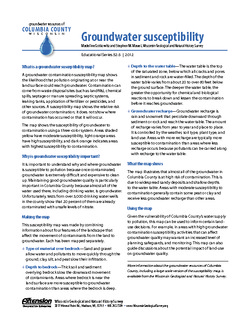
Groundwater Resources of Columbia County, Wisconsin
Three-part series describes the results of a comprehensive inventory and assessment of Columbia County's groundwater resources. Covers water-table elevation, groundwater recharge, and groundwater susceptibility. -
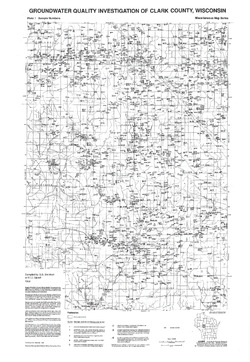
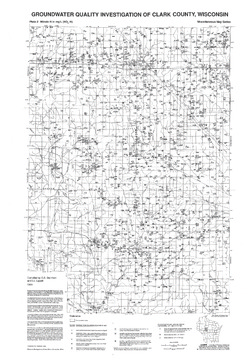
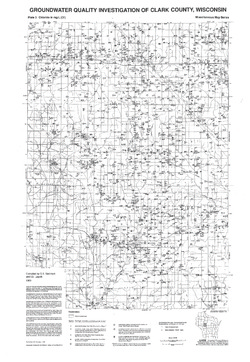
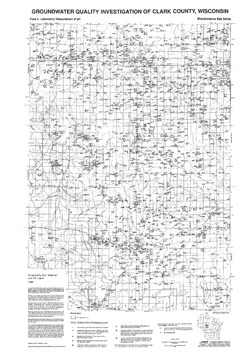
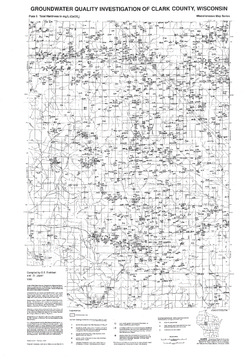
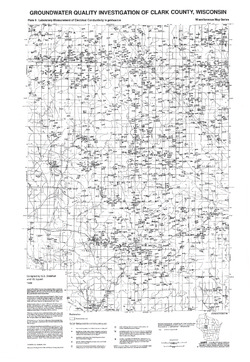
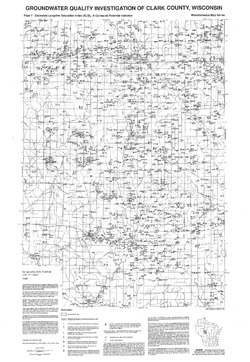
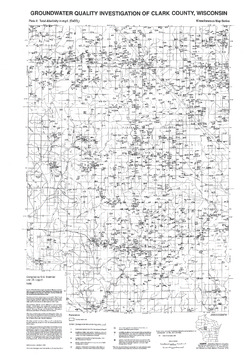
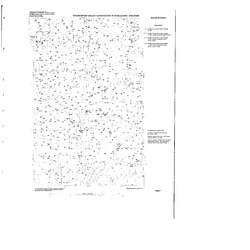
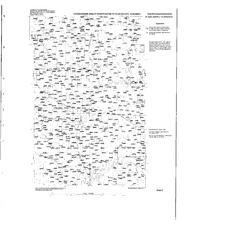
Groundwater Quality Investigation of Clark County, Wisconsin
Includes Plate 1: Sample Numbers; Plate 2: Nitrate-N in mg/L; Plate 3: Chloride in mg/L; Plate 4: Laboratory Measurement of pH; Plate 5: Total Hardness in mg/L; Plate 6: Laboratory Measurement of Electrical Conductivity in μmhos/cm; Plate 7: Estimated Langelier Saturation Index (ELSI); Plate 8: Total Alkalinity in mg/L. -
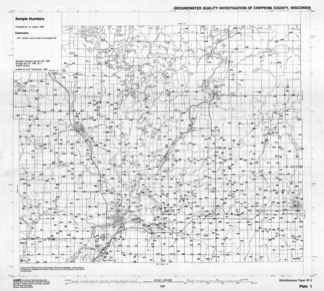
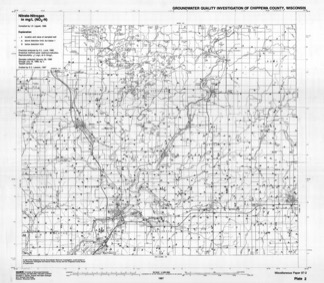
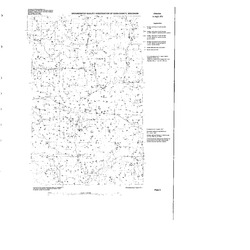
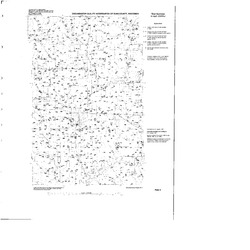
Groundwater Quality Investigation of Chippewa County, Wisconsin
Includes Plate 1: Sample Numbers. Plate 2: Nitrate–Nitrogen in mg/L. Plate 3: Chloride in mg/L. Plate 4: Laboratory Measurement of pH. Plate 5: Total Hardness in mg/L. Plate 6: Conductivity in µmhos/cm. Plate 7: Ferrous iron in mg/L.-
Groundwater Quality Investigation of Chippewa County, Wisconsin: Sample Numbers [plate 1]
1987
Map: 25.9 in x 23.3 in, scale 1:100,000
-
Groundwater Quality Investigation of Chippewa County, Wisconsin: Nitrate-Nitrogen in mg/L [plate 2]
1987
Map: 26.7 in x 23.3 in, scale 1:100,000
-
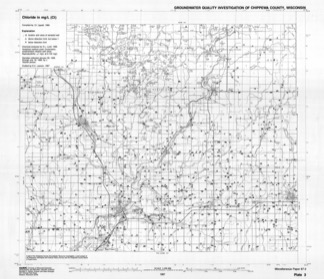
Groundwater Quality Investigation of Chippewa County, Wisconsin: Chloride in mg/L [plate 3]
1987
Map: 27 in x 23.3 in, scale 1:100,000
-
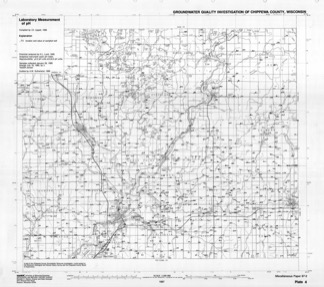
Groundwater Quality Investigation of Chippewa County, Wisconsin: Laboratory Measurement of pH [plate 4]
1987
Map: 26.7 in x 23.7 in, scale 1:100,000
-
Groundwater Quality Investigation of Chippewa County, Wisconsin: Total Hardness in mg/L [plate 5]
1987
Map: 26.9 in x 23.4 in, scale 1:100,000
-
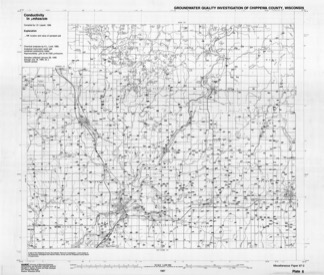
Groundwater Quality Investigation of Chippewa County, Wisconsin: Conductivity in ?mhos/cm [plate 6]
1987
Map: 27.4 in x 23.3 in, scale 1:100,000
-
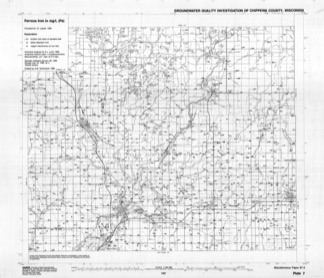
Groundwater Quality Investigation of Chippewa County, Wisconsin: Ferrous Iron in mg/L [plate 7]
1987
Map: 27.4 in x 23.6 in, scale 1:100,000
-
-
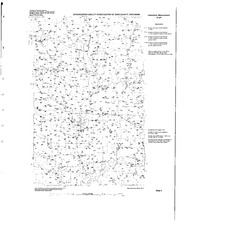
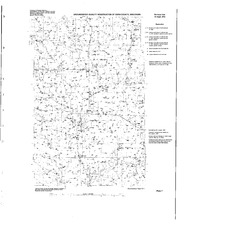
Groundwater Quality Investigation of Dunn County, Wisconsin
Includes Plate 1: Sample Numbers. Plate 2: Nitrate–N in mg/L. Plate 3: Chloride in mg/L. Plate 4: Laboratory Measurement of pH. Plate 5: Total Hardness in mg/L. Plate 6: Total Hardness/Conductivity. Plate 7: Ferrous iron in mg/L.-
Groundwater Quality Investigation of Dunn County, Wisconsin: Sample Numbers [plate 1]
1987
Map: 34 in x 34 in, scale 1:100,000
-
Groundwater Quality Investigation of Dunn County, Wisconsin: Nitrate-Nitrogen in mg/L [plate 2]
1987
Map: 34 in x 34 in, scale 1:100,000
-
Groundwater Quality Investigation of Dunn County, Wisconsin: Chloride in mg/L [plate 3]
1987
Map: 34 in x 34 in, scale 1:100,000
-
Groundwater Quality Investigation of Dunn County, Wisconsin: Laboratory Measurement of pH [plate 4]
1987
Map: 34 in x 34 in, scale 1:100,000
-
Groundwater Quality Investigation of Dunn County, Wisconsin: Total Hardness in mg/L [plate 5]
1987
Map: 34 in x 34 in, scale 1:100,000
-
Groundwater Quality Investigation of Dunn County, Wisconsin: Total Hardness/Conductivity in mg/L, in ?mhos/cm [plate 6]
1987
Map: 34 in x 34 in, scale 1:100,000
-
Groundwater Quality Investigation of Dunn County, Wisconsin: Ferrous Iron in mg/L [plate 7]
1987
Map: 34 in x 34 in, scale 1:100,000
-

Publications Catalog
Wisconsin Geological and Natural History Survey