-
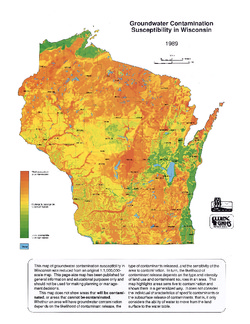
Groundwater Contamination Susceptibility in Wisconsin
How susceptible are different areas of Wisconsin to groundwater contamination? This map gives a quick visual overview. It was created using type of bedrock, depth to bedrock, depth to water table, soil type, and surface deposits. -
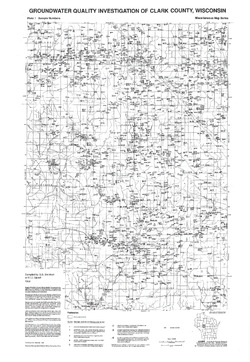
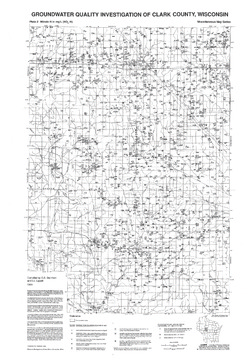
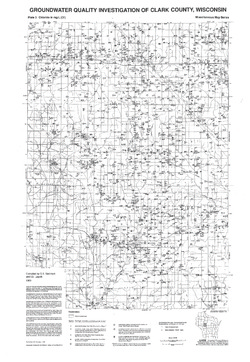
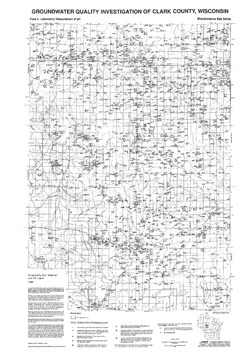
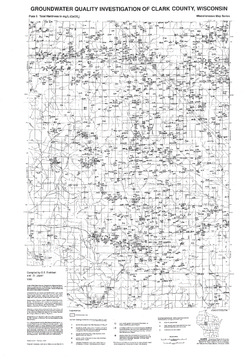
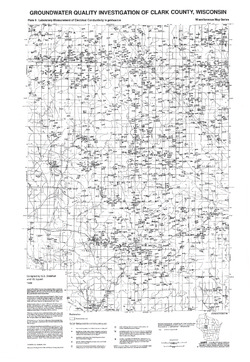
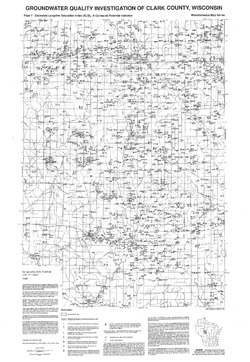
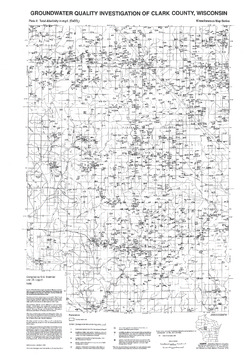
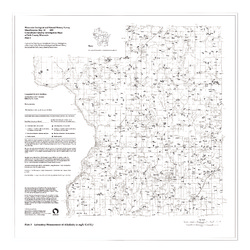
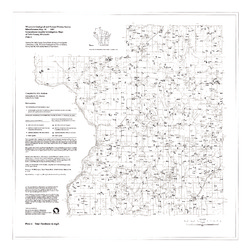
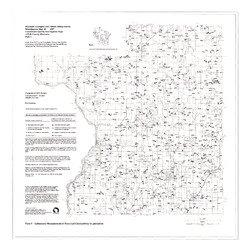
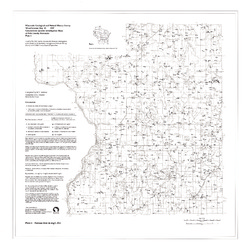
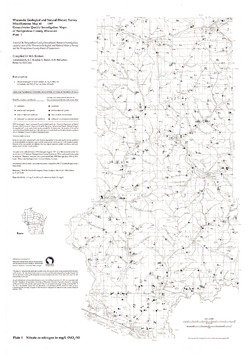
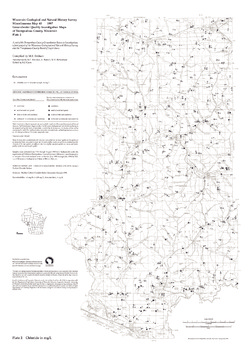
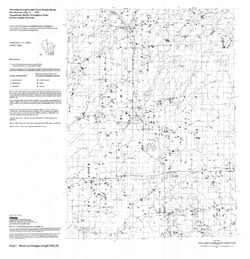
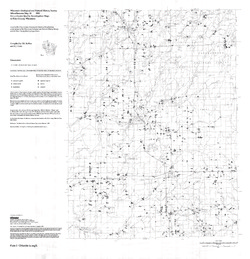
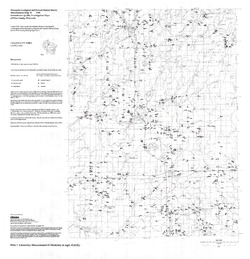
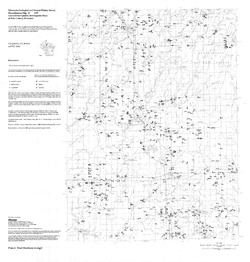
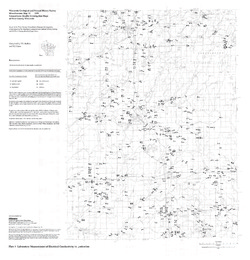
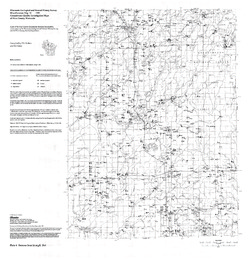
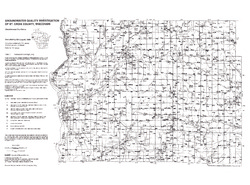
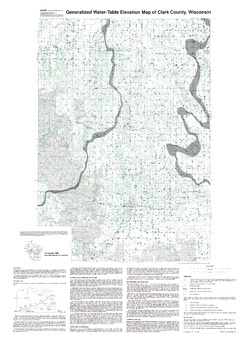
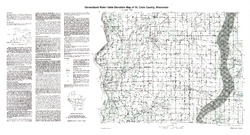
Groundwater Quality Investigation of Clark County, Wisconsin
Includes Plate 1: Sample Numbers; Plate 2: Nitrate-N in mg/L; Plate 3: Chloride in mg/L; Plate 4: Laboratory Measurement of pH; Plate 5: Total Hardness in mg/L; Plate 6: Laboratory Measurement of Electrical Conductivity in μmhos/cm; Plate 7: Estimated Langelier Saturation Index (ELSI); Plate 8: Total Alkalinity in mg/L. -
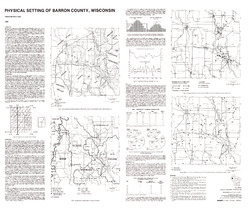
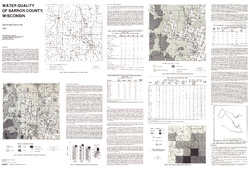
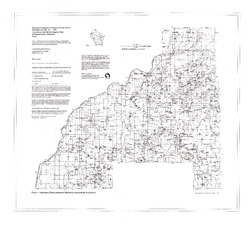
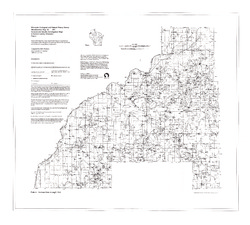
Atlas of Groundwater Resources and Geology of Barron County, Wisconsin
Includes Physical Setting; Soils of Barron County and Their Ability to Attenuate Pollutants; Bedrock Geology; Depth to Bedrock; Hydrogeology; Water Quality; Potential Sources of Groundwater Pollution; Groundwater Levels; Groundwater Pollution Potential.-
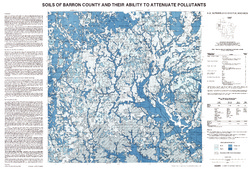
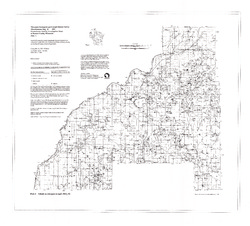
Atlas of Groundwater Resources and Geology of Barron County, Wisconsin: Soils of Barron County and Their Ability to Attenuate Pollutants
1987
Map: 30.8 in x 20.8 in, scale 1:100,000
-
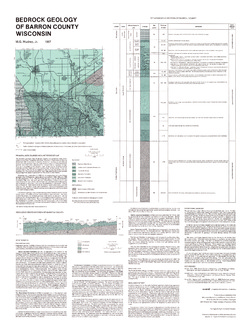
Atlas of Groundwater Resources and Geology of Barron County, Wisconsin: Bedrock Geology of Barron County, Wisconsin
1987
Map: 21.5 in x 28.5 in, scale 1:250,000
-
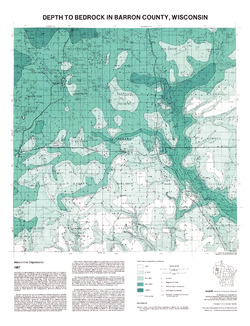
Atlas of Groundwater Resources and Geology of Barron County, Wisconsin: Depth to Bedrock in Barron County, Wisconsin
1987
Map: 21.1 in x 27.6 in, scale 1:100,000
-
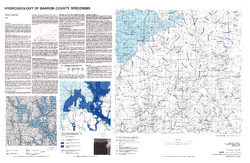
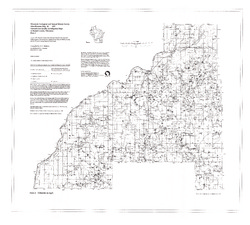
Atlas of Groundwater Resources and Geology of Barron County, Wisconsin: Hydrogeology of Barron County, Wisconsin
1987
Map: 37.5 in x 24.5 in, scale 1:100,000
-
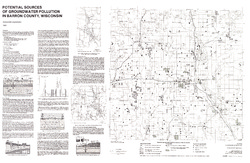
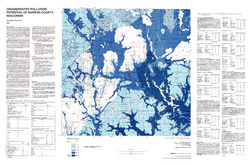
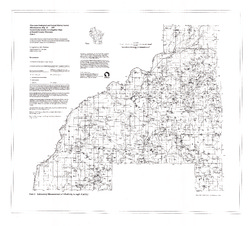
Atlas of Groundwater Resources and Geology of Barron County, Wisconsin: Potential Sources of Groundwater Pollution in Barron County, Wisconsin
1987
Map: 35.75 in x 23.3 in, scale 1:100,000
-
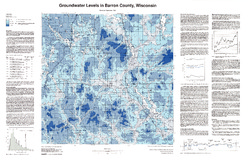
Atlas of Groundwater Resources and Geology of Barron County, Wisconsin: Groundwater Levels in Barron County, Wisconsin
1987
Map: 35.8 in x 23.3 in, scale 1:100,000
-
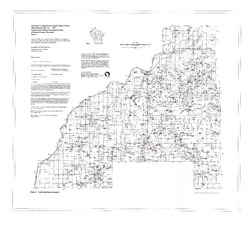
Atlas of Groundwater Resources and Geology of Barron County, Wisconsin: Groundwater Pollution Potential of Barron County, Wisconsin
1987
Map: 36.7 in x 24.25 in, scale 1:100,000
-
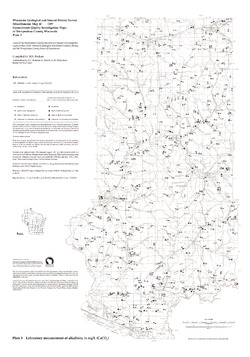
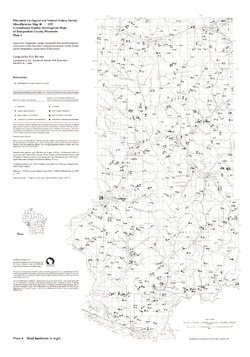
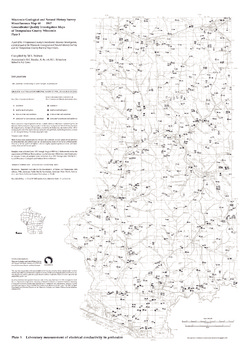
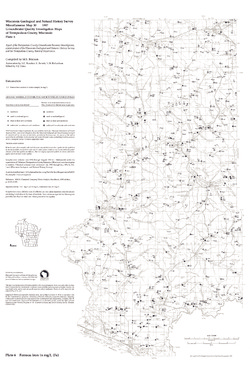
Groundwater Quality Investigation Maps of Buffalo County, Wisconsin
Includes Plate 1: Nitrate as Nitrogen in mg/L. Plate 2: Chloride in mg/L. Plate 3: Laboratory Measurement of Alkalinity in mg/L. Plate 4: Total Hardness in mg/L. Plate 5: Laboratory Measurement of Electrical Conductivity in μmhos/cm. Plate 6: Ferrous Iron in mg/L. -
Groundwater Quality Investigation Maps of Polk County, Wisconsin
Includes Plate 1: Nitrate as Nitrogen in mg/L. Plate 2: Chloride in mg/L. Plate 3: Laboratory Measurement of Alkalinity in mg/L. Plate 4: Total Hardness in mg/L. Plate 5: Laboratory Measurement of Electrical Conductivity in μmhos/cm. Plate 6: Ferrous Iron in mg/L. -
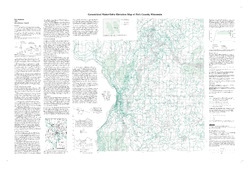
Groundwater Quality Investigation Maps of Trempealeau County, Wisconsin
Includes Plate 1: Nitrate as Nitrogen in mg/L. Plate 2: Chloride in mg/L. Plate 3: Laboratory Measurement of Alkalinity in mg/L. Plate 4: Total Hardness in mg/L. Plate 5: Laboratory Measurement of Electrical Conductivity in μmhos/cm. Plate 6: Ferrous Iron in mg/L. -
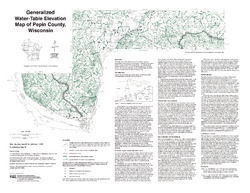
Groundwater Quality Investigation Maps of Pepin County, Wisconsin
Includes Plate 1: Nitrate as Nitrogen in mg/L. Plate 2: Chloride in mg/L. Plate 3: Laboratory Measurement of Alkalinity in mg/L. Plate 4: Total Hardness in mg/L. Plate 5: Laboratory Measurement of Electrical Conductivity in μmhos/cm. Plate 6: Ferrous Iron in mg/L. -
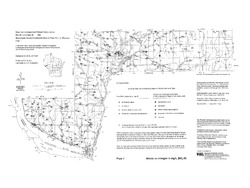
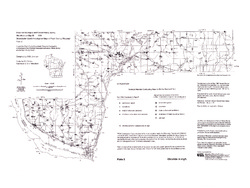
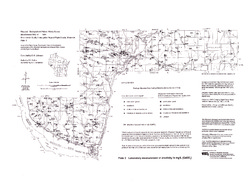
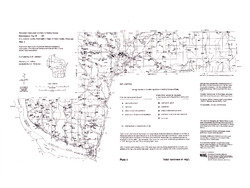
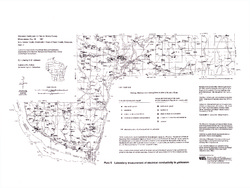
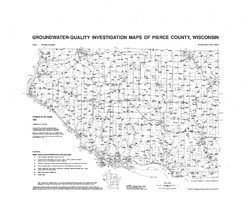
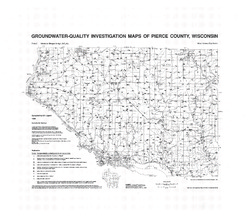
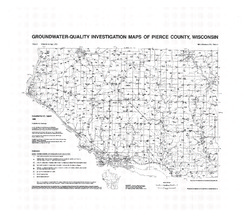
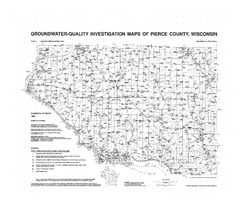
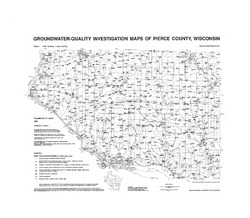
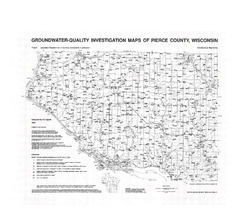
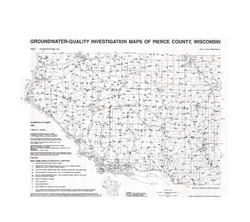
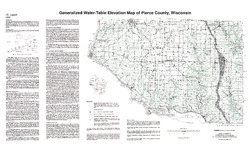
Groundwater-Quality Investigation Maps of Pierce County, Wisconsin
Includes Plate 1: Sample Numbers (map 90-3a). Plate 2: Nitrate as Nitrogen in mg/L (map 90-3b). Plate 3: Chloride in mg/L (map 90-3c). Plate 4: Laboratory Measurement of pH (map 90-3d). Plate 5: Total Hardness in mg/L (map 90-3e). Plate 6: Laboratory Measurement of Electrical Conductivity in μmhos/cm (map 90-3f). Plate 7: Ferrous Iron in mg/L (map 90-3g). -
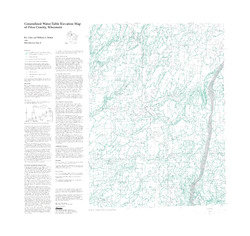
Groundwater Quality Investigation Maps of Price County, Wisconsin
Includes Plate 1: Nitrate as Nitrogen in mg/L. Plate 2: Chloride in mg/L. Plate 3: Laboratory Measurement of Alkalinity in mg/L. Plate 4: Total Hardness in mg/L. Plate 5: Laboratory Measurement of Electrical Conductivity in μmhos/cm. Plate 6: Ferrous Iron in mg/L. -
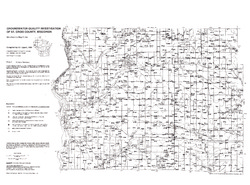
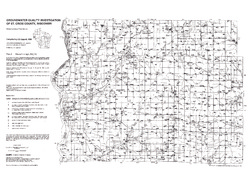
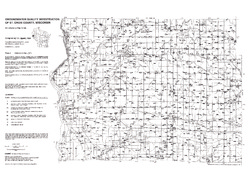
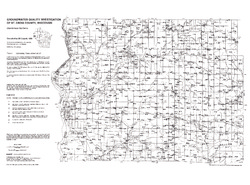
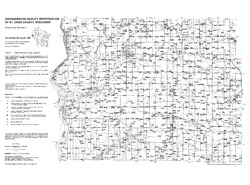
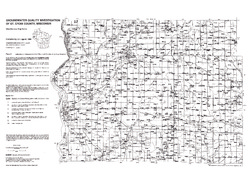
Groundwater Quality Investigation of St. Croix County, Wisconsin
Includes Plate 1: Sample Numbers (map 89-5a). Plate 2: Nitrate-N in mg/L (map 89-5b). Plate 3: Chloride in mg/L (map 89-5c). Plate 4: Laboratory Measurement of pH (map 89-5d). Plate 5: Total Hardness in mg/L (map 89-5e). Plate 6: Laboratory Measurement of Electrical Conductivity in μmhos/cm (map 89-5f). Plate 7: Ferrous Iron in mg/L (map 89-5g)....

Publications Catalog
Wisconsin Geological and Natural History Survey