-
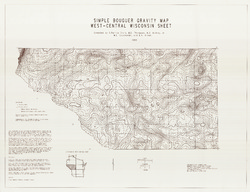
Simple Bouguer Anomaly Gravity Map, West Central Wisconsin Sheet
-
Simple Bouguer Gravity Map, West-Central Wisconsin Sheet
1993
Map: 43.3 in x 33.2 in, scale 1:250,000
-
-
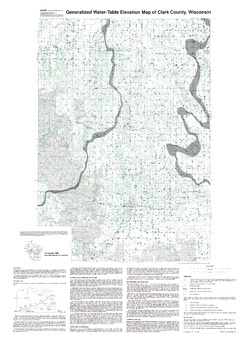
Generalized Water-Table Elevation of Clark County, Wisconsin
-
Generalized Water-Table Elevation Map of Clark County, Wisconsin
1990
Map: 27.5 in x 38 in, scale 1:100,000
-
-
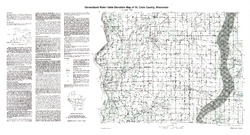
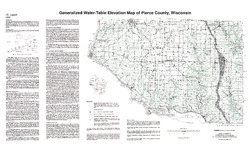
Generalized Water-Table Elevation of St. Croix County, Wisconsin
-
Generalized Water-Table Elevation Map of St. Croix County, Wisconsin
1990
Map: 34.8 in x 18.8 in, scale 1:100,000
-
-
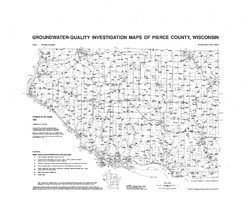
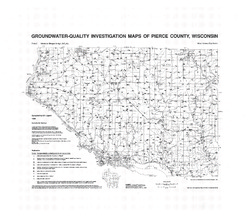
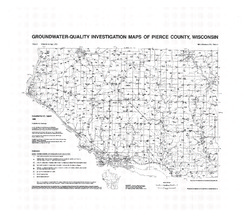
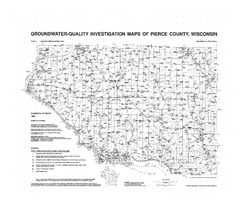
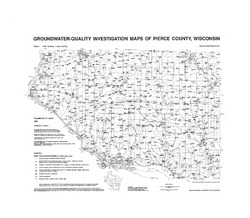
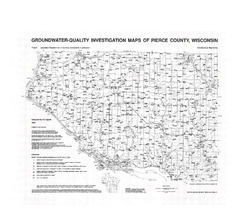
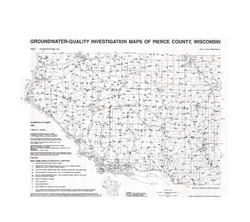
Groundwater-Quality Investigation Maps of Pierce County, Wisconsin
Includes Plate 1: Sample Numbers (map 90-3a). Plate 2: Nitrate as Nitrogen in mg/L (map 90-3b). Plate 3: Chloride in mg/L (map 90-3c). Plate 4: Laboratory Measurement of pH (map 90-3d). Plate 5: Total Hardness in mg/L (map 90-3e). Plate 6: Laboratory Measurement of Electrical Conductivity in μmhos/cm (map 90-3f). Plate 7: Ferrous Iron in mg/L (map 90-3g).-
Groundwater-Quality Investigation Maps of Pierce County, Wisconsin: Sample Numbers [plate 1]
1990
Map: 27.5 in x 24 in
-
Groundwater-Quality Investigation Maps of Pierce County, Wisconsin: Chloride in mg/L [plate 3]
1990
Map: 27.5 in x 24 in
-
Groundwater-Quality Investigation Maps of Pierce County, Wisconsin: Total Hardness in mg/L [plate 5]
1990
Map: 27.5 in x 24 in
-
-
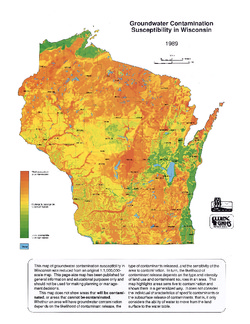
Groundwater Contamination Susceptibility in Wisconsin
How susceptible are different areas of Wisconsin to groundwater contamination? This map gives a quick visual overview. It was created using type of bedrock, depth to bedrock, depth to water table, soil type, and surface deposits. -
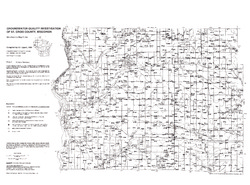
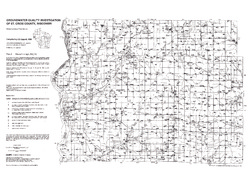
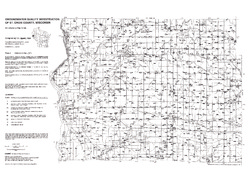
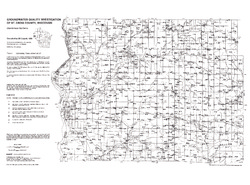
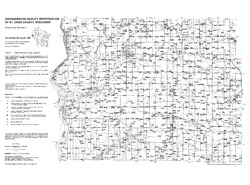
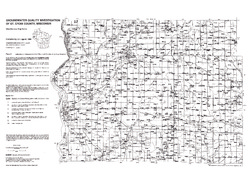
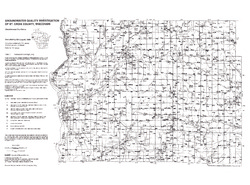
Groundwater Quality Investigation of St. Croix County, Wisconsin
Includes Plate 1: Sample Numbers (map 89-5a). Plate 2: Nitrate-N in mg/L (map 89-5b). Plate 3: Chloride in mg/L (map 89-5c). Plate 4: Laboratory Measurement of pH (map 89-5d). Plate 5: Total Hardness in mg/L (map 89-5e). Plate 6: Laboratory Measurement of Electrical Conductivity in μmhos/cm (map 89-5f). Plate 7: Ferrous Iron in mg/L (map 89-5g)....-
Groundwater Quality Investigation of St. Croix County, Wisconsin: Sample Numbers [plate 1]
1989
Map: 27 in x 20 in
-
Groundwater Quality Investigation of St. Croix County, Wisconsin: Nitrate-N in mg/L [plate 2]
1989
Map: 27 in x 20 in
-
Groundwater Quality Investigation of St. Croix County, Wisconsin: Chloride in mg/L [plate 3]
1989
Map: 27 in x 20 in
-
Groundwater Quality Investigation of St. Croix County, Wisconsin: Ferrous Iron in mg/L [plate 7]
1989
Map: 27 in x 20 in
-
-
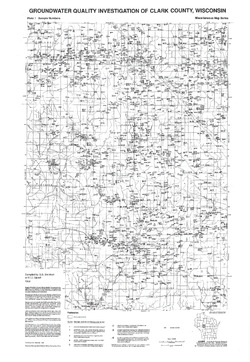
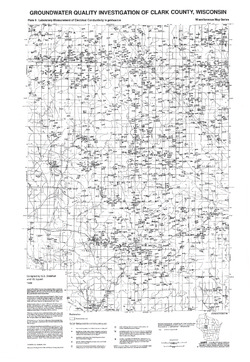
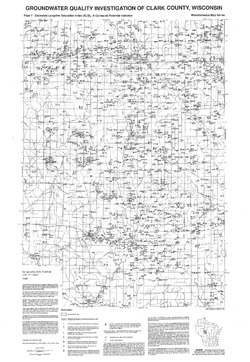
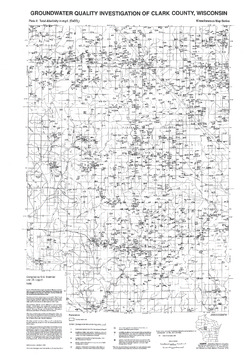
Groundwater Quality Investigation of Clark County, Wisconsin
Includes Plate 1: Sample Numbers; Plate 2: Nitrate-N in mg/L; Plate 3: Chloride in mg/L; Plate 4: Laboratory Measurement of pH; Plate 5: Total Hardness in mg/L; Plate 6: Laboratory Measurement of Electrical Conductivity in μmhos/cm; Plate 7: Estimated Langelier Saturation Index (ELSI); Plate 8: Total Alkalinity in mg/L.-
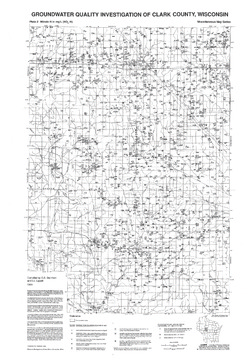
Groundwater Quality Investigation of Clark County, Wisconsin: Sample Numbers [plate 1]
1989
Map: 23.5 in x 34 in
-
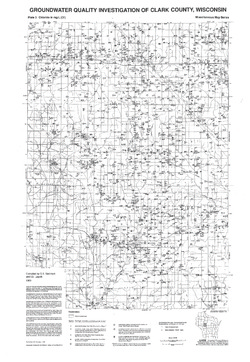
Groundwater Quality Investigation of Clark County, Wisconsin: Nitrate-N in mg/L [plate 2]
1989
Map: 23.5 in x 34 in
-
Groundwater Quality Investigation of Clark County, Wisconsin: Chloride in mg/L [plate 3]
1989
Map: 23.5 in x 34 in
-
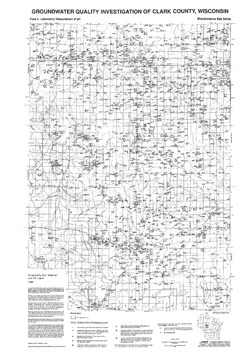
Groundwater Quality Investigation of Clark County, Wisconsin: Laboratory Measurement of pH [plate 4]
1989
Map: 23.5 in x 34 in
-
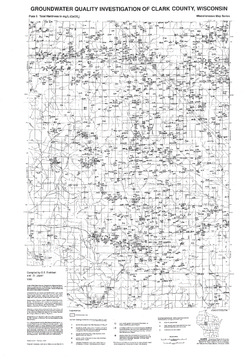
Groundwater Quality Investigation of Clark County, Wisconsin: Total Hardness in mg/L [plate 5]
1989
Map: 23.5 in x 34 in
-
Groundwater Quality Investigation of Clark County, Wisconsin: Total Alkalinity in mg/L [plate 8]
1989
Map: 23.5 in x 34 in
-
-
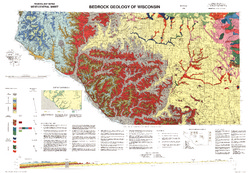
Bedrock Geology of Wisconsin, West-Central Sheet
Types of bedrock, formation names, major faults, and time period of formation.-
Bedrock Geology of Wisconsin, West-Central Sheet [GIS data]
1988
GIS Data: GeMS file geodatabase (.gdb file format)
-
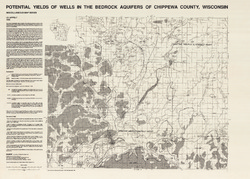
Potential Yields of Wells in the Bedrock Aquifers of Chippewa County, Wisconsin
-
Potential Yields of Wells in the Bedrock Aquifers of Chippewa County, Wisconsin
1988
Map: 31.5 in x 22.5 in, scale 1:100,000
-
-
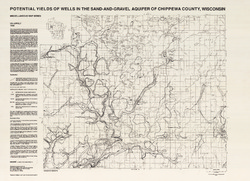
Potential Yields of Wells in the Sand and Gravel Aquifer of Chippewa County, Wisconsin
-
Potential Yields of Wells in the Sand-and-Gravel Aquifer of Chippewa County, Wisconsin
1988
Map: 31 in x 22.5 in, scale 1:100,000
-
-
Potential Yields of Wells in the Sand-and-Gravel Aquifer of Dunn County, Wisconsin
-
Potential Yields of Wells in the Sand-and-Gravel Aquifer of Dunn County, Wisconsin
1988
Map: 22.5 in x 30 in, scale 1:100,000
-
-
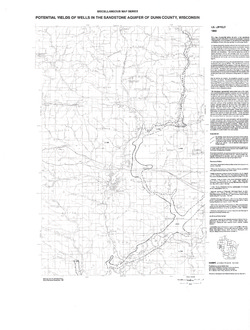
Potential Yields of Wells in the Sandstone Aquifer of Dunn County, Wisconsin
-
Potential Yields of Wells in the Sandstone Aquifer of Dunn County, Wisconsin
1988
Map: 23.2 in x 30.6 in, scale 1:100,000
-

Publications Catalog
Wisconsin Geological and Natural History Survey