-
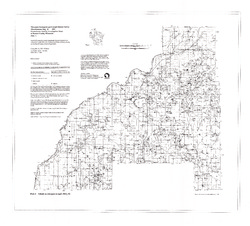
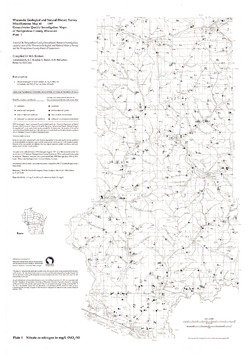
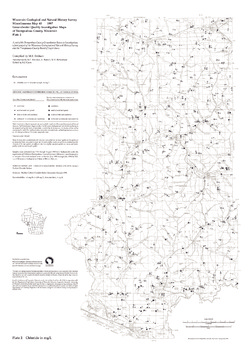
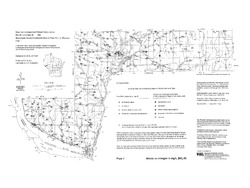
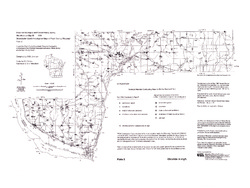
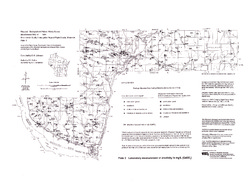
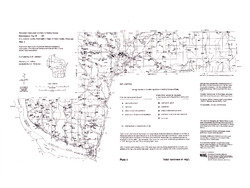
Groundwater Quality Investigation Maps of Buffalo County, Wisconsin
Includes Plate 1: Nitrate as Nitrogen in mg/L. Plate 2: Chloride in mg/L. Plate 3: Laboratory Measurement of Alkalinity in mg/L. Plate 4: Total Hardness in mg/L. Plate 5: Laboratory Measurement of Electrical Conductivity in μmhos/cm. Plate 6: Ferrous Iron in mg/L.-
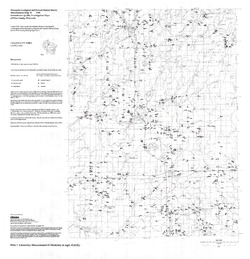
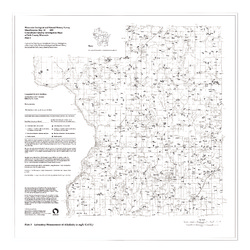
Groundwater Quality Investigation Maps of Buffalo County, Wisconsin: Nitrate as Nitrogen in mg/L [plate 1]
2001
Map: 20 in x 30 in, scale 1:100,000
-
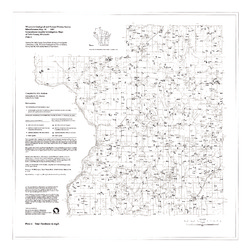
Groundwater Quality Investigation Maps of Buffalo County, Wisconsin: Chloride in mg/L [plate 2]
2001
Map: 20 in x 30 in, scale 1:100,000
-
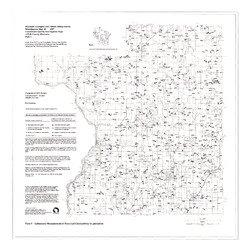
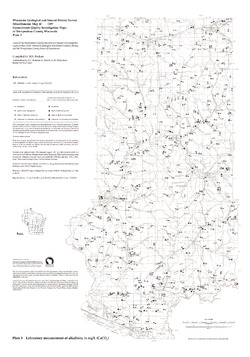
Groundwater Quality Investigation Maps of Buffalo County, Wisconsin: Laboratory Measurement of Alkalinity in mg/L [plate 3]
2001
Map: 20 in x 30 in, scale 1:100,000
-
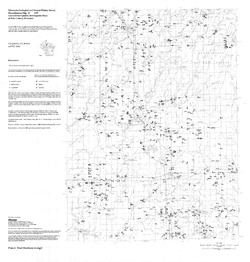
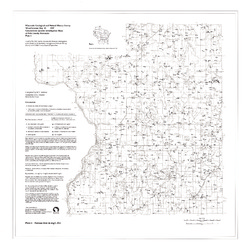
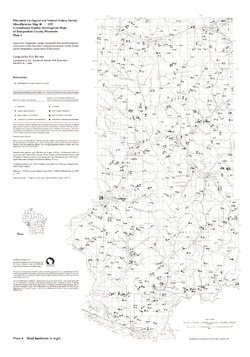
Groundwater Quality Investigation Maps of Buffalo County, Wisconsin: Total Hardness in mg/L [plate 4]
2001
Map: 19.7 in x 27.7 in, scale 1:100,000
-
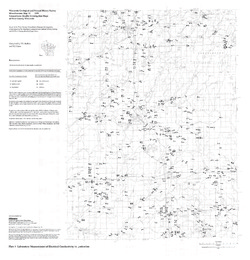
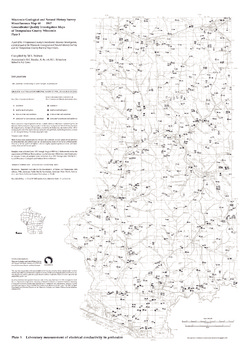
Groundwater Quality Investigation Maps of Buffalo County, Wisconsin: Laboratory Measurement of Electrical Conductivity in ?mhos/cm [plate 5]
2001
Map: 21 in x 30 in, scale 1:100,000
-
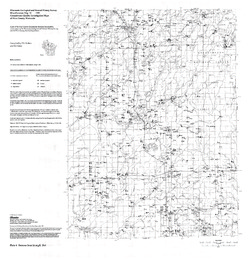
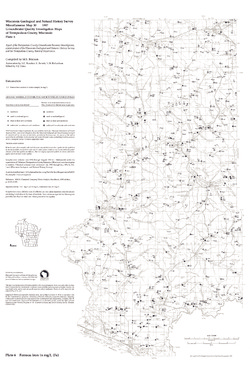
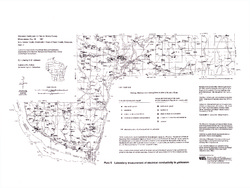
Groundwater Quality Investigation Maps of Buffalo County, Wisconsin: Ferrous Iron in mg/L [plate 6]
2001
Map: 20 in x 30 in, scale 1:100,000
-
-
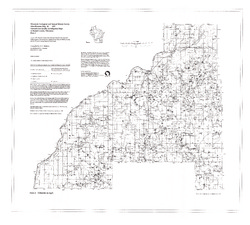
Groundwater Quality Investigation Maps of Price County, Wisconsin
Includes Plate 1: Nitrate as Nitrogen in mg/L. Plate 2: Chloride in mg/L. Plate 3: Laboratory Measurement of Alkalinity in mg/L. Plate 4: Total Hardness in mg/L. Plate 5: Laboratory Measurement of Electrical Conductivity in μmhos/cm. Plate 6: Ferrous Iron in mg/L.-
Groundwater Quality Investigation Maps of Price County, Wisconsin: Nitrate as Nitrogen in mg/L [plate 1]
1999
Map: 29 in x 30 in, scale 1:100,000
-
Groundwater Quality Investigation Maps of Price County, Wisconsin: Chloride in mg/L [plate 2]
1999
Map: 29 in x 30 in, scale 1:100,000
-
Groundwater Quality Investigation Maps of Price County, Wisconsin: Laboratory Measurement of Alkalinity in mg/L [plate 3]
1999
Map: 29 in x 30 in, scale 1:100,000
-
Groundwater Quality Investigation Maps of Price County, Wisconsin: Total Hardness in mg/L [plate 4]
1999
Map: 28.7 in x 30 in, scale 1:100,000
-
Groundwater Quality Investigation Maps of Price County, Wisconsin: Laboratory Measurement of Electrical Conductivity in ?mhos/cm [plate 5]
1999
Map: 28.9 in x 30 in, scale 1:100,000
-
Groundwater Quality Investigation Maps of Price County, Wisconsin: Ferrous Iron in mg/L [plate 6]
1999
Map: 29 in x 30 in, scale 1:100,000
-
-
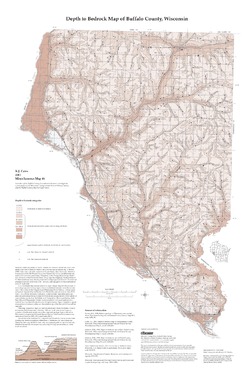
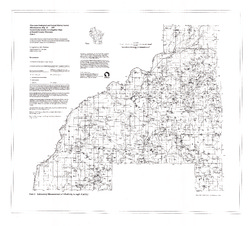
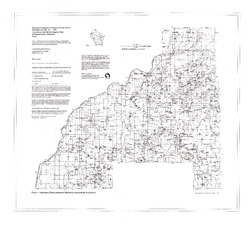
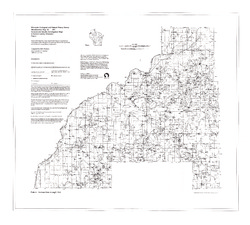
Generalized Water-Table Elevation Map of Buffalo County, Wisconsin
-
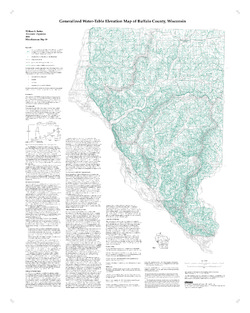
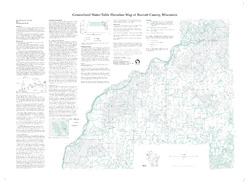
Generalized Water-Table Elevation Map of Buffalo County, Wisconsin
2000
Map: 28 in x 35 in, scale 1:100,000
-
-
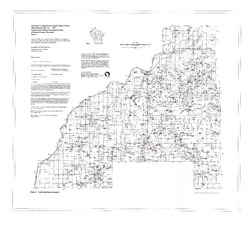
Generalized Water-Table Elevation Map of Price County, Wisconsin
-
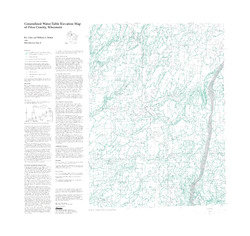
Generalized Water-Table Elevation Map of Price County, Wisconsin
1999
Map: 31.5 in x 30 in, scale 1:100,000
-
-
Generalized Water-Table Elevation Map of Polk County, Wisconsin
-
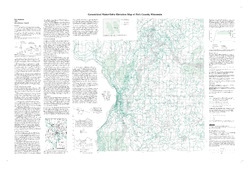
Generalized Water-Table Elevation Map of Polk County, Wisconsin
2000
Map: 43 in x 29 in, scale 1:100,000
-
-
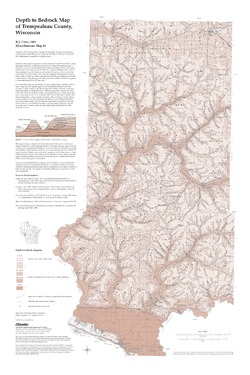
Generalized Water-Table Elevation Map of Trempealeau County, Wisconsin
-
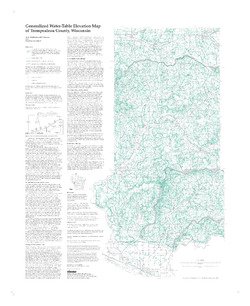
Generalized Water-Table Elevation Map of Trempealeau County, Wisconsin
1998
Map: 27 in x 33 in, scale 1:100,000
-
Generalized Water-Table Elevation Map of Trempealeau County, Wisconsin" [GIS data]
1998
Map: Coverage (.e00 file format)
-
-
Generalized Water-Table Elevation Map of Burnett County, Wisconsin
-
Generalized Water-Table Elevation Map of Burnett County, Wisconsin
1998
Map: 38 in x 28 in, scale 1:100,000
-
-
Green Bay Area Private Claims and Williams Grant Subdivision in Brown County, Wisconsin
-
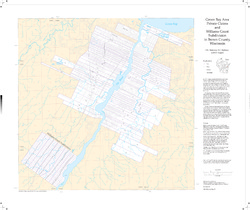
Green Bay Area Private Claims and Williams Grant Subdivision in Brown County, Wisconsin
1997
Map: 30.8 in x 25.9 in, scale 1:36,000
-
-
Groundwater Quality Investigation Maps of Polk County, Wisconsin
Includes Plate 1: Nitrate as Nitrogen in mg/L. Plate 2: Chloride in mg/L. Plate 3: Laboratory Measurement of Alkalinity in mg/L. Plate 4: Total Hardness in mg/L. Plate 5: Laboratory Measurement of Electrical Conductivity in μmhos/cm. Plate 6: Ferrous Iron in mg/L.-
Groundwater Quality Investigation Maps of Polk County, Wisconsin: Nitrate as Nitrogen in mg/L [plate 1]
1997
Map: 30 in x 30 in, scale 1:100,000
-
Groundwater Quality Investigation Maps of Polk County, Wisconsin: Chloride in mg/L [plate 2]
1997
Map: 30 in x 30 in, scale 1:100,000
-
Groundwater Quality Investigation Maps of Polk County, Wisconsin: Laboratory Measurement of Alkalinity in mg/L [plate 3]
1997
Map: 30 in x 30 in, scale 1:100,000
-
Groundwater Quality Investigation Maps of Polk County, Wisconsin: Total Hardness in mg/L [plate 4]
1997
Map: 30 in x 30 in, scale 1:100,000
-
Groundwater Quality Investigation Maps of Polk County, Wisconsin: Laboratory Measurement of Electrical Conductivity in ?mhos/cm [plate 5]
1997
Map: 30 in x 30 in, scale 1:100,000
-
Groundwater Quality Investigation Maps of Polk County, Wisconsin: Ferrous Iron in mg/L [plate 6]
1997
Map: 30 in x 30 in, scale 1:100,000
-
-
Groundwater Quality Investigation Maps of Burnett County, Wisconsin
-
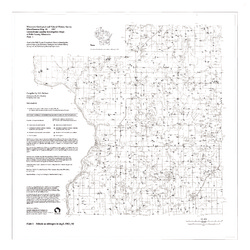
Groundwater Quality Investigation Maps of Burnett County, Wisconsin: Nitrate as Nitrogen in mg/L [plate 1]
1997
Map: 35.2 in x 31.8 in, scale 1:100,000
-
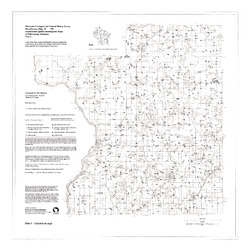
Groundwater Quality Investigation Maps of Burnett County, Wisconsin: Chloride in mg/L [plate 2]
1997
Map: 34.8 in x 31.3 in, scale 1:100,000
-
Groundwater Quality Investigation Maps of Burnett County, Wisconsin: Laboratory Measurement of Alkalinity in mg/L [plate 3]
1997
Map: 34.7 in x 31.3 in, scale 1:100,000
-
Groundwater Quality Investigation Maps of Burnett County, Wisconsin: Total Hardness in mg/L [plate 4]
1997
Map: 35.2 in x 31.7 in, scale 1:100,000
-
Groundwater Quality Investigation Maps of Burnett County, Wisconsin: Laboratory Measurement of Electrical Conductivity in ?mhos/cm [plate 5]
1997
Map: 35.5 in x 32 in, scale 1:100,000
-
Groundwater Quality Investigation Maps of Burnett County, Wisconsin: Ferrous Iron in mg/L [plate 6]
1997
Map: 35.5 in x 32 in, scale 1:100,000
-
-
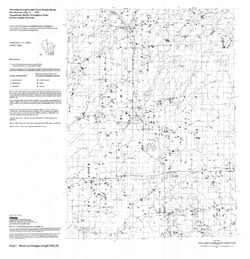
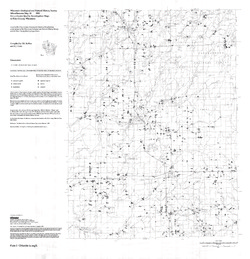
Groundwater Quality Investigation Maps of Trempealeau County, Wisconsin
Includes Plate 1: Nitrate as Nitrogen in mg/L. Plate 2: Chloride in mg/L. Plate 3: Laboratory Measurement of Alkalinity in mg/L. Plate 4: Total Hardness in mg/L. Plate 5: Laboratory Measurement of Electrical Conductivity in μmhos/cm. Plate 6: Ferrous Iron in mg/L.-
Groundwater Quality Investigation Maps of Trempealeau County, Wisconsin: Nitrate as Nitrogen in mg/L [plate 1]
1997
Map: 21 in x 30 in, scale 1:100,000
-
Groundwater Quality Investigation Maps of Trempealeau County, Wisconsin: Chloride in mg/L [plate 2]
1997
Map: 21 in x 30 in, scale 1:100,000
-
Groundwater Quality Investigation Maps of Trempealeau County, Wisconsin: Laboratory Measurement of Alkalinity in mg/L [plate 3]
1997
Map: 21 in x 30 in, scale 1:100,000
-
Groundwater Quality Investigation Maps of Trempealeau County, Wisconsin: Total Hardness in mg/L [plate 4]
1997
Map: 21 in x 30 in, scale 1:100,000
-
Groundwater Quality Investigation Maps of Trempealeau County, Wisconsin: Laboratory Measurement of Electrical Conductivity in ?mhos/cm [plate 5]
1997
Map: 21 in x 30 in, scale 1:100,000
-
Groundwater Quality Investigation Maps of Trempealeau County, Wisconsin: Ferrous Iron in mg/L [plate 6]
1997
Map: 20 in x 30 in, scale 1:100,000
-
-
Groundwater Quality Investigation Maps of Pepin County, Wisconsin
Includes Plate 1: Nitrate as Nitrogen in mg/L. Plate 2: Chloride in mg/L. Plate 3: Laboratory Measurement of Alkalinity in mg/L. Plate 4: Total Hardness in mg/L. Plate 5: Laboratory Measurement of Electrical Conductivity in μmhos/cm. Plate 6: Ferrous Iron in mg/L.-
Groundwater Quality Investigation Maps of Pepin County, Wisconsin: Nitrate as Nitrogen in mg/L [plate 1]
1994
Map: 24 in x 18 in, scale 1:100,000
-
Groundwater Quality Investigation Maps of Pepin County, Wisconsin: Chloride in mg/L [plate 2]
1994
Map: 24 in x 18 in, scale 1:100,000
-
Groundwater Quality Investigation Maps of Pepin County, Wisconsin: Laboratory Measurement of Alkalinity in mg/L [plate 3]
1994
Map: 24 in x 18 in, scale 1:100,000
-
Groundwater Quality Investigation Maps of Pepin County, Wisconsin: Total Hardness in mg/L [plate 4]
1994
Map: 24 in x 18 in, scale 1:100,000
-
Groundwater Quality Investigation Maps of Pepin County, Wisconsin: Laboratory Measurement of Electrical Conductivity in ?mhos/cm [plate 5]
1994
Map: 24 in x 18 in, scale 1:100,000
-
Groundwater Quality Investigation Maps of Pepin County, Wisconsin: Ferrous Iron in mg/L [plate 6]
1994
Map: 23.7 in x 17.6 in, scale 1:100,000
-
-
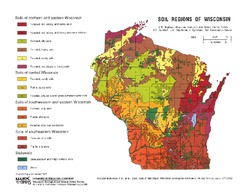
Soil Regions of Wisconsin
Shows 15 general soil regions of Wisconsin. On the landscape, many of these regions appear distinctly different from each other because differences in land form and use are often related to the characteristics of the soils. -
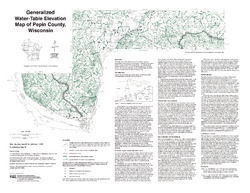
Generalized Water-Table Elevation of Pepin County, Wisconsin
-
Generalized Water-Table Elevation Map of Pepin County, Wisconsin
1993
Map: 25 in x 19.3 in, scale 1:100,000
-
-
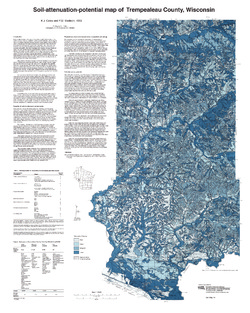
Soil-Attenuation-Potential Map of Trempealeau County, Wisconsin
-
Soil-Attenuation-Potential Map of Trempealeau County, Wisconsin
1993
Map: 24 in x 30 in, scale 1:100,000
-
-
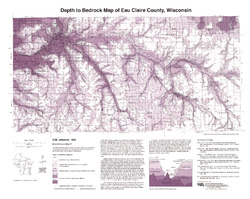
Generalized Water-Table Elevation of Eau Claire County, Wisconsin
-
Generalized Water-Table Elevation Map of Eau Claire County, Wisconsin
1992
Map: 24.5 in x 25 in, scale 1:100,000
-

Publications Catalog
Wisconsin Geological and Natural History Survey