-
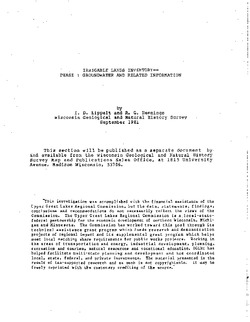
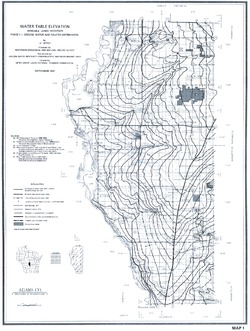
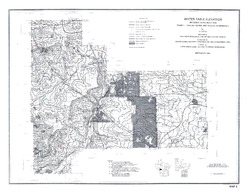
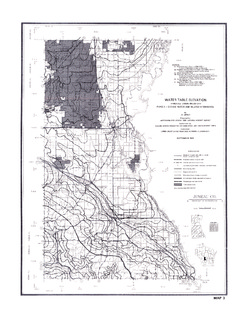
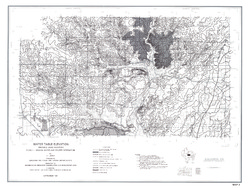
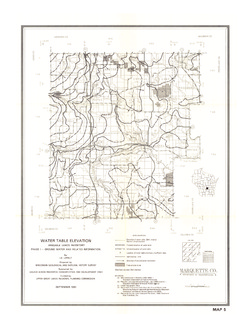
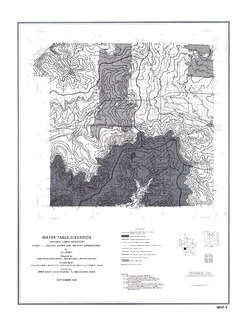
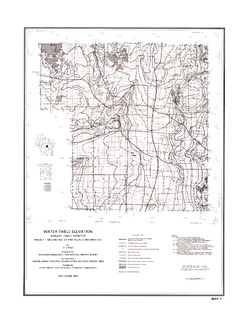
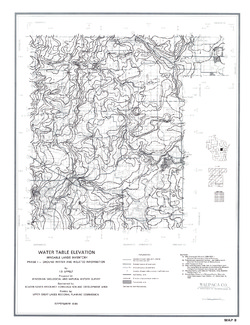
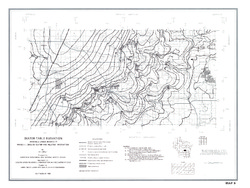
Irrigable Lands Inventory--Phase I Groundwater and Related Information
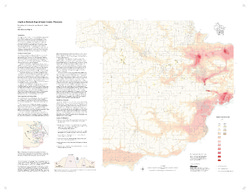
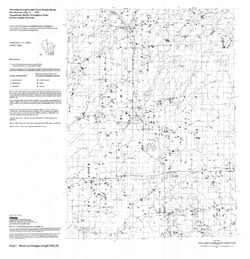
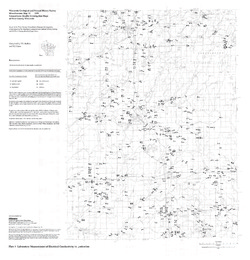
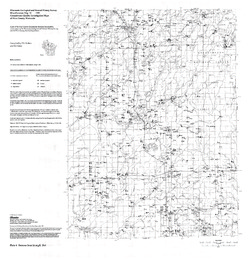
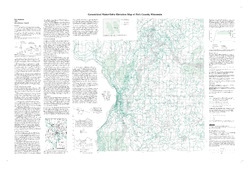
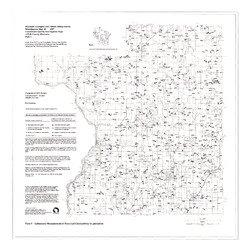
This paper contains hydrogeologic information for the Golden Sands Resource Conservation and Development Area in central Wisconsin. The set of maps includes water-table elevation maps for the following counties: Adams, Jackson, Juneau, Marathon, Marquette, Monroe, Portage, Waupaca, Waushara, and Wood (scale 1:126,720). It also includes a regional aquifer...-
Irrigable Lands Inventory - Phase I Groundwater and Related Information
1981
Report: 13 p., 11 maps, scale 1:126,720 and 1:500,000
- 2 more...
-
-
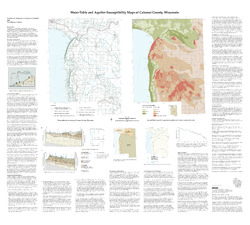
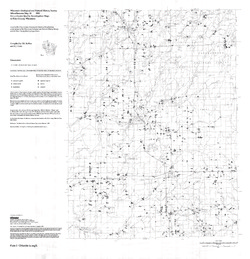
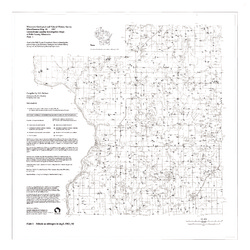
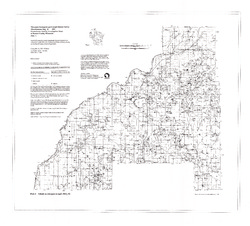
Water-Table and Aquifer Susceptibility Maps of Calumet County, Wisconsin
-
Water-Table and Aquifer-Susceptibility Maps of Calumet County, Wisconsin
2006
Map: 40.3 in x 36.3 in, scale 1:100,000
-
Water-Table and Aquifer-Susceptibility Maps of Calumet County, Wisconsin [GIS data]
2006
Map: Coverage (.e00 file format)
-
-
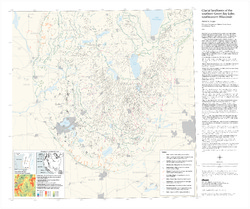
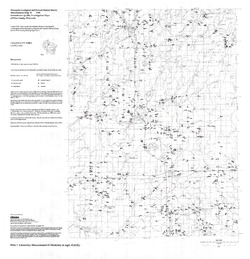
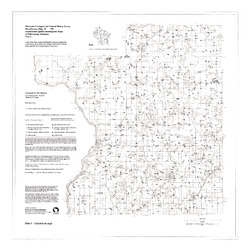
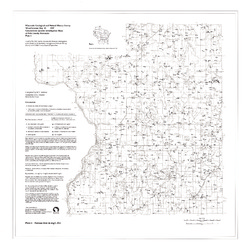
Water-Table Elevation Map of Sauk County, Wisconsin
-
Water-Table Elevation Map of Sauk County, Wisconsin [GIS data]
2002
Map: Coverage (.e00 file format)
-
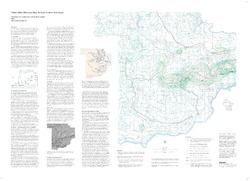
Glacial Landforms of the Southern Green Bay Lobe, Southeastern Wisconsin
Shows the features (such as drumlins, moraines, and eskers) created by the southern Green Bay Lobe of the Laurentide Ice Sheet in southeastern Wisconsin.-
Glacial Landforms of the Southern Green Bay Lobe, Southeastern Wisconsin
2003
Map: 35 in x 30 in, scale 1:250,000
-
-
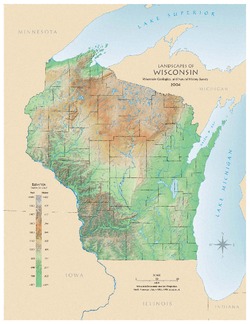
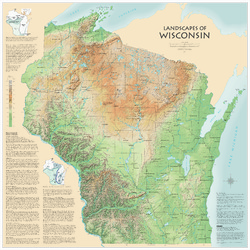
Landscapes of Wisconsin
Shows the elevation of Wisconsin through the use of color and shaded relief. Includes explanatory text about the geologic history of the state and more detailed information about 12 of the most prominent features. Poster map scale 1:500,000. Size: 42 x 42 inches. -
Groundwater Quality Investigation Maps of Buffalo County, Wisconsin
Includes Plate 1: Nitrate as Nitrogen in mg/L. Plate 2: Chloride in mg/L. Plate 3: Laboratory Measurement of Alkalinity in mg/L. Plate 4: Total Hardness in mg/L. Plate 5: Laboratory Measurement of Electrical Conductivity in μmhos/cm. Plate 6: Ferrous Iron in mg/L.-
Groundwater Quality Investigation Maps of Buffalo County, Wisconsin: Nitrate as Nitrogen in mg/L [plate 1]
2001
Map: 20 in x 30 in, scale 1:100,000
-
Groundwater Quality Investigation Maps of Buffalo County, Wisconsin: Chloride in mg/L [plate 2]
2001
Map: 20 in x 30 in, scale 1:100,000
-
Groundwater Quality Investigation Maps of Buffalo County, Wisconsin: Laboratory Measurement of Alkalinity in mg/L [plate 3]
2001
Map: 20 in x 30 in, scale 1:100,000
-
Groundwater Quality Investigation Maps of Buffalo County, Wisconsin: Total Hardness in mg/L [plate 4]
2001
Map: 19.7 in x 27.7 in, scale 1:100,000
-
Groundwater Quality Investigation Maps of Buffalo County, Wisconsin: Laboratory Measurement of Electrical Conductivity in ?mhos/cm [plate 5]
2001
Map: 21 in x 30 in, scale 1:100,000
-
Groundwater Quality Investigation Maps of Buffalo County, Wisconsin: Ferrous Iron in mg/L [plate 6]
2001
Map: 20 in x 30 in, scale 1:100,000
-
-
Groundwater Quality Investigation Maps of Price County, Wisconsin
Includes Plate 1: Nitrate as Nitrogen in mg/L. Plate 2: Chloride in mg/L. Plate 3: Laboratory Measurement of Alkalinity in mg/L. Plate 4: Total Hardness in mg/L. Plate 5: Laboratory Measurement of Electrical Conductivity in μmhos/cm. Plate 6: Ferrous Iron in mg/L.-
Groundwater Quality Investigation Maps of Price County, Wisconsin: Nitrate as Nitrogen in mg/L [plate 1]
1999
Map: 29 in x 30 in, scale 1:100,000
-
Groundwater Quality Investigation Maps of Price County, Wisconsin: Chloride in mg/L [plate 2]
1999
Map: 29 in x 30 in, scale 1:100,000
-
Groundwater Quality Investigation Maps of Price County, Wisconsin: Laboratory Measurement of Alkalinity in mg/L [plate 3]
1999
Map: 29 in x 30 in, scale 1:100,000
-
Groundwater Quality Investigation Maps of Price County, Wisconsin: Total Hardness in mg/L [plate 4]
1999
Map: 28.7 in x 30 in, scale 1:100,000
-
Groundwater Quality Investigation Maps of Price County, Wisconsin: Laboratory Measurement of Electrical Conductivity in ?mhos/cm [plate 5]
1999
Map: 28.9 in x 30 in, scale 1:100,000
-
Groundwater Quality Investigation Maps of Price County, Wisconsin: Ferrous Iron in mg/L [plate 6]
1999
Map: 29 in x 30 in, scale 1:100,000
-
-
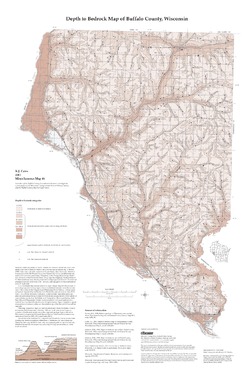
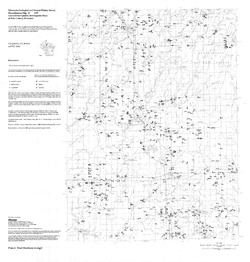
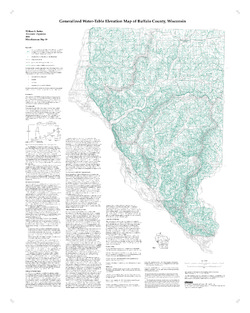
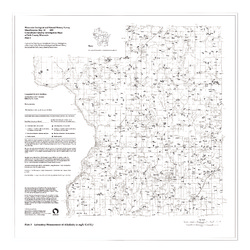
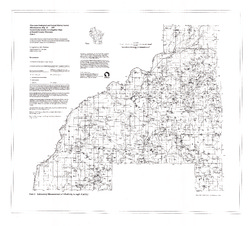
Generalized Water-Table Elevation Map of Buffalo County, Wisconsin
-
Generalized Water-Table Elevation Map of Buffalo County, Wisconsin
2000
Map: 28 in x 35 in, scale 1:100,000
-
-
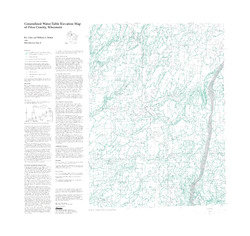
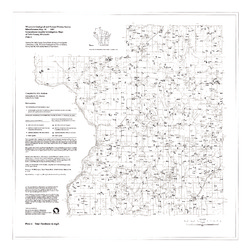
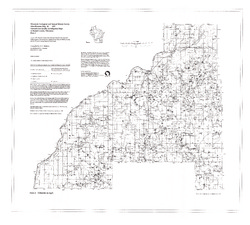
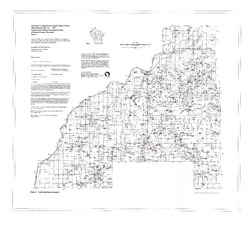
Generalized Water-Table Elevation Map of Price County, Wisconsin
-
Generalized Water-Table Elevation Map of Price County, Wisconsin
1999
Map: 31.5 in x 30 in, scale 1:100,000
-
-
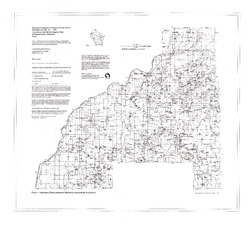
Generalized Water-Table Elevation Map of Polk County, Wisconsin
-
Generalized Water-Table Elevation Map of Polk County, Wisconsin
2000
Map: 43 in x 29 in, scale 1:100,000
-
-
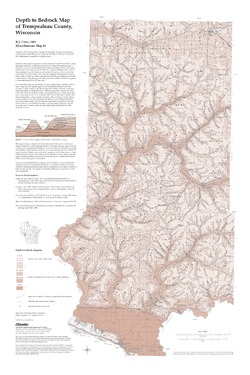
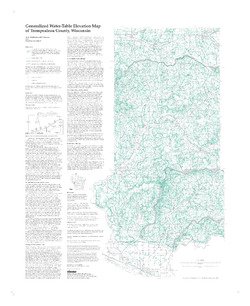
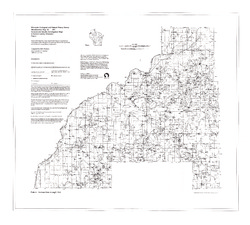
Generalized Water-Table Elevation Map of Trempealeau County, Wisconsin
-
Generalized Water-Table Elevation Map of Trempealeau County, Wisconsin
1998
Map: 27 in x 33 in, scale 1:100,000
-
Generalized Water-Table Elevation Map of Trempealeau County, Wisconsin" [GIS data]
1998
Map: Coverage (.e00 file format)
-
-
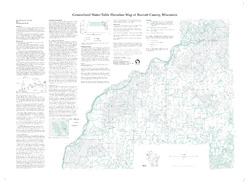
Generalized Water-Table Elevation Map of Burnett County, Wisconsin
-
Generalized Water-Table Elevation Map of Burnett County, Wisconsin
1998
Map: 38 in x 28 in, scale 1:100,000
-
-
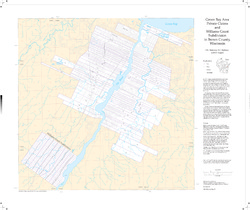
Green Bay Area Private Claims and Williams Grant Subdivision in Brown County, Wisconsin
-
Green Bay Area Private Claims and Williams Grant Subdivision in Brown County, Wisconsin
1997
Map: 30.8 in x 25.9 in, scale 1:36,000
-
-
Groundwater Quality Investigation Maps of Polk County, Wisconsin
Includes Plate 1: Nitrate as Nitrogen in mg/L. Plate 2: Chloride in mg/L. Plate 3: Laboratory Measurement of Alkalinity in mg/L. Plate 4: Total Hardness in mg/L. Plate 5: Laboratory Measurement of Electrical Conductivity in μmhos/cm. Plate 6: Ferrous Iron in mg/L.-
Groundwater Quality Investigation Maps of Polk County, Wisconsin: Nitrate as Nitrogen in mg/L [plate 1]
1997
Map: 30 in x 30 in, scale 1:100,000
-
Groundwater Quality Investigation Maps of Polk County, Wisconsin: Chloride in mg/L [plate 2]
1997
Map: 30 in x 30 in, scale 1:100,000
-
Groundwater Quality Investigation Maps of Polk County, Wisconsin: Laboratory Measurement of Alkalinity in mg/L [plate 3]
1997
Map: 30 in x 30 in, scale 1:100,000
-
Groundwater Quality Investigation Maps of Polk County, Wisconsin: Total Hardness in mg/L [plate 4]
1997
Map: 30 in x 30 in, scale 1:100,000
-
Groundwater Quality Investigation Maps of Polk County, Wisconsin: Laboratory Measurement of Electrical Conductivity in ?mhos/cm [plate 5]
1997
Map: 30 in x 30 in, scale 1:100,000
-
Groundwater Quality Investigation Maps of Polk County, Wisconsin: Ferrous Iron in mg/L [plate 6]
1997
Map: 30 in x 30 in, scale 1:100,000
-
-
Groundwater Quality Investigation Maps of Burnett County, Wisconsin
-
Groundwater Quality Investigation Maps of Burnett County, Wisconsin: Nitrate as Nitrogen in mg/L [plate 1]
1997
Map: 35.2 in x 31.8 in, scale 1:100,000
-
Groundwater Quality Investigation Maps of Burnett County, Wisconsin: Chloride in mg/L [plate 2]
1997
Map: 34.8 in x 31.3 in, scale 1:100,000
-
Groundwater Quality Investigation Maps of Burnett County, Wisconsin: Laboratory Measurement of Alkalinity in mg/L [plate 3]
1997
Map: 34.7 in x 31.3 in, scale 1:100,000
-
Groundwater Quality Investigation Maps of Burnett County, Wisconsin: Total Hardness in mg/L [plate 4]
1997
Map: 35.2 in x 31.7 in, scale 1:100,000
-
Groundwater Quality Investigation Maps of Burnett County, Wisconsin: Laboratory Measurement of Electrical Conductivity in ?mhos/cm [plate 5]
1997
Map: 35.5 in x 32 in, scale 1:100,000
-
Groundwater Quality Investigation Maps of Burnett County, Wisconsin: Ferrous Iron in mg/L [plate 6]
1997
Map: 35.5 in x 32 in, scale 1:100,000
-

Publications Catalog
Wisconsin Geological and Natural History Survey