-
Groundwater Quality Investigation Maps of Trempealeau County, Wisconsin
Includes Plate 1: Nitrate as Nitrogen in mg/L. Plate 2: Chloride in mg/L. Plate 3: Laboratory Measurement of Alkalinity in mg/L. Plate 4: Total Hardness in mg/L. Plate 5: Laboratory Measurement of Electrical Conductivity in μmhos/cm. Plate 6: Ferrous Iron in mg/L.-
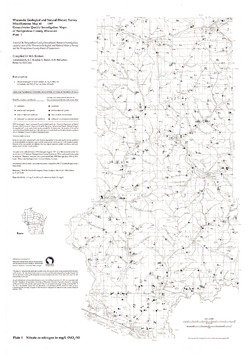
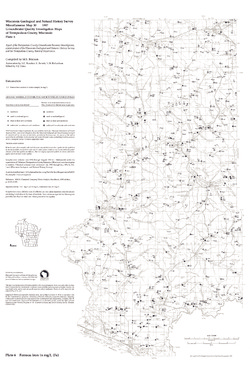
Groundwater Quality Investigation Maps of Trempealeau County, Wisconsin: Nitrate as Nitrogen in mg/L [plate 1]
1997
Map: 21 in x 30 in, scale 1:100,000
-
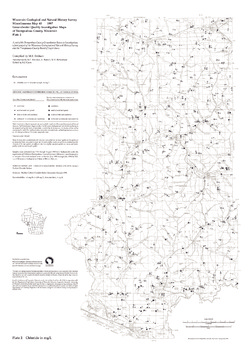
Groundwater Quality Investigation Maps of Trempealeau County, Wisconsin: Chloride in mg/L [plate 2]
1997
Map: 21 in x 30 in, scale 1:100,000
-
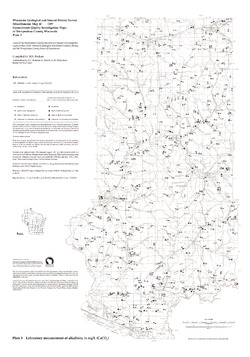
Groundwater Quality Investigation Maps of Trempealeau County, Wisconsin: Laboratory Measurement of Alkalinity in mg/L [plate 3]
1997
Map: 21 in x 30 in, scale 1:100,000
-
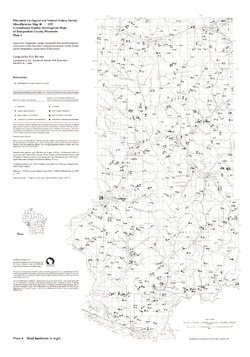
Groundwater Quality Investigation Maps of Trempealeau County, Wisconsin: Total Hardness in mg/L [plate 4]
1997
Map: 21 in x 30 in, scale 1:100,000
-
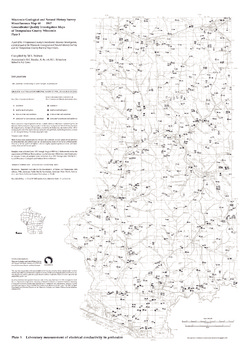
Groundwater Quality Investigation Maps of Trempealeau County, Wisconsin: Laboratory Measurement of Electrical Conductivity in ?mhos/cm [plate 5]
1997
Map: 21 in x 30 in, scale 1:100,000
-
Groundwater Quality Investigation Maps of Trempealeau County, Wisconsin: Ferrous Iron in mg/L [plate 6]
1997
Map: 20 in x 30 in, scale 1:100,000
-
-
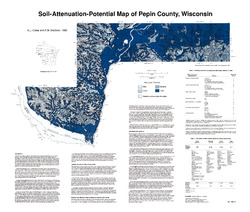
Groundwater Quality Investigation Maps of Pepin County, Wisconsin
Includes Plate 1: Nitrate as Nitrogen in mg/L. Plate 2: Chloride in mg/L. Plate 3: Laboratory Measurement of Alkalinity in mg/L. Plate 4: Total Hardness in mg/L. Plate 5: Laboratory Measurement of Electrical Conductivity in μmhos/cm. Plate 6: Ferrous Iron in mg/L.-
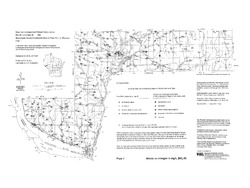
Groundwater Quality Investigation Maps of Pepin County, Wisconsin: Nitrate as Nitrogen in mg/L [plate 1]
1994
Map: 24 in x 18 in, scale 1:100,000
-
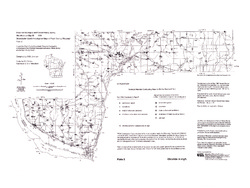
Groundwater Quality Investigation Maps of Pepin County, Wisconsin: Chloride in mg/L [plate 2]
1994
Map: 24 in x 18 in, scale 1:100,000
-
Groundwater Quality Investigation Maps of Pepin County, Wisconsin: Laboratory Measurement of Alkalinity in mg/L [plate 3]
1994
Map: 24 in x 18 in, scale 1:100,000
-
Groundwater Quality Investigation Maps of Pepin County, Wisconsin: Total Hardness in mg/L [plate 4]
1994
Map: 24 in x 18 in, scale 1:100,000
-
Groundwater Quality Investigation Maps of Pepin County, Wisconsin: Laboratory Measurement of Electrical Conductivity in ?mhos/cm [plate 5]
1994
Map: 24 in x 18 in, scale 1:100,000
-
Groundwater Quality Investigation Maps of Pepin County, Wisconsin: Ferrous Iron in mg/L [plate 6]
1994
Map: 23.7 in x 17.6 in, scale 1:100,000
-
-
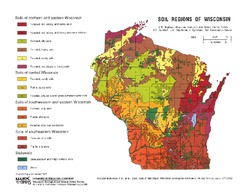
Soil Regions of Wisconsin
Shows 15 general soil regions of Wisconsin. On the landscape, many of these regions appear distinctly different from each other because differences in land form and use are often related to the characteristics of the soils. -
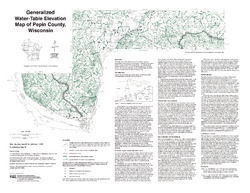
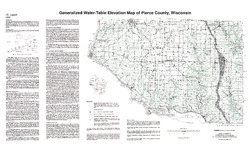
Generalized Water-Table Elevation of Pepin County, Wisconsin
-
Generalized Water-Table Elevation Map of Pepin County, Wisconsin
1993
Map: 25 in x 19.3 in, scale 1:100,000
-
-
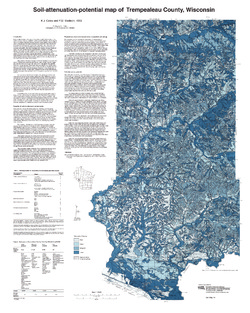
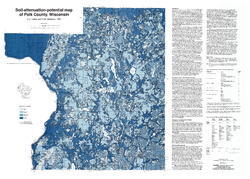
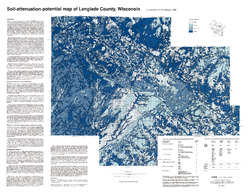
Soil-Attenuation-Potential Map of Trempealeau County, Wisconsin
-
Soil-Attenuation-Potential Map of Trempealeau County, Wisconsin
1993
Map: 24 in x 30 in, scale 1:100,000
-
-
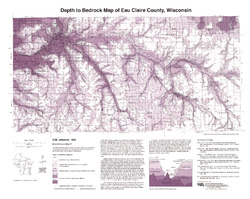
Generalized Water-Table Elevation of Eau Claire County, Wisconsin
-
Generalized Water-Table Elevation Map of Eau Claire County, Wisconsin
1992
Map: 24.5 in x 25 in, scale 1:100,000
-
-
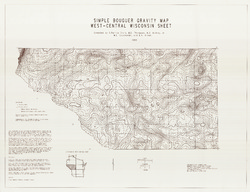
Simple Bouguer Anomaly Gravity Map, West Central Wisconsin Sheet
-
Simple Bouguer Gravity Map, West-Central Wisconsin Sheet
1993
Map: 43.3 in x 33.2 in, scale 1:250,000
-
-
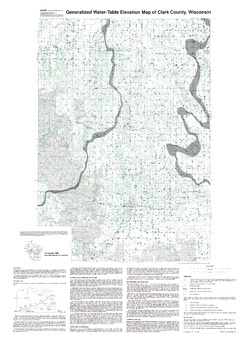
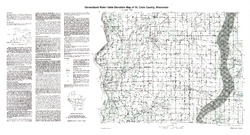
Generalized Water-Table Elevation of Clark County, Wisconsin
-
Generalized Water-Table Elevation Map of Clark County, Wisconsin
1990
Map: 27.5 in x 38 in, scale 1:100,000
-
-
Generalized Water-Table Elevation of St. Croix County, Wisconsin
-
Generalized Water-Table Elevation Map of St. Croix County, Wisconsin
1990
Map: 34.8 in x 18.8 in, scale 1:100,000
-
-
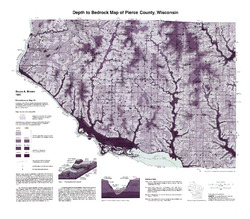
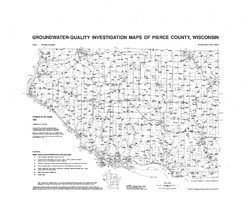
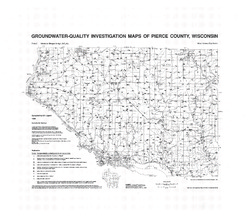
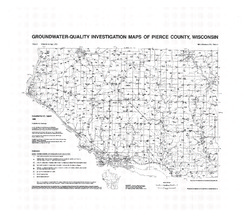
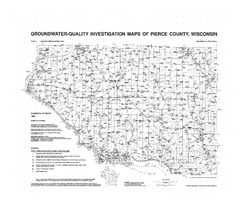
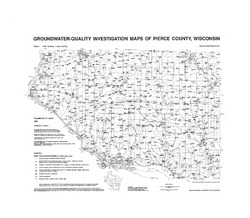
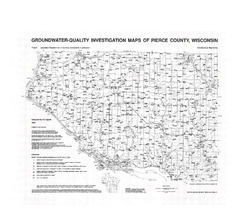
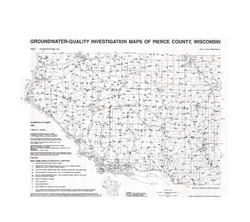
Groundwater-Quality Investigation Maps of Pierce County, Wisconsin
Includes Plate 1: Sample Numbers (map 90-3a). Plate 2: Nitrate as Nitrogen in mg/L (map 90-3b). Plate 3: Chloride in mg/L (map 90-3c). Plate 4: Laboratory Measurement of pH (map 90-3d). Plate 5: Total Hardness in mg/L (map 90-3e). Plate 6: Laboratory Measurement of Electrical Conductivity in μmhos/cm (map 90-3f). Plate 7: Ferrous Iron in mg/L (map 90-3g).-
Groundwater-Quality Investigation Maps of Pierce County, Wisconsin: Sample Numbers [plate 1]
1990
Map: 27.5 in x 24 in
-
Groundwater-Quality Investigation Maps of Pierce County, Wisconsin: Chloride in mg/L [plate 3]
1990
Map: 27.5 in x 24 in
-
Groundwater-Quality Investigation Maps of Pierce County, Wisconsin: Total Hardness in mg/L [plate 5]
1990
Map: 27.5 in x 24 in
-
-
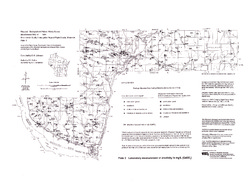
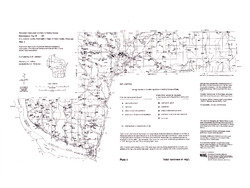
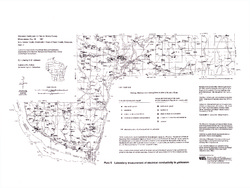
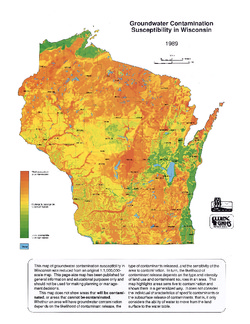
Groundwater Contamination Susceptibility in Wisconsin
How susceptible are different areas of Wisconsin to groundwater contamination? This map gives a quick visual overview. It was created using type of bedrock, depth to bedrock, depth to water table, soil type, and surface deposits. -
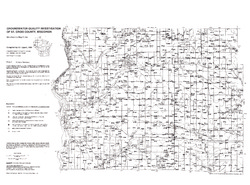
Groundwater Quality Investigation of St. Croix County, Wisconsin
Includes Plate 1: Sample Numbers (map 89-5a). Plate 2: Nitrate-N in mg/L (map 89-5b). Plate 3: Chloride in mg/L (map 89-5c). Plate 4: Laboratory Measurement of pH (map 89-5d). Plate 5: Total Hardness in mg/L (map 89-5e). Plate 6: Laboratory Measurement of Electrical Conductivity in μmhos/cm (map 89-5f). Plate 7: Ferrous Iron in mg/L (map 89-5g)....-
Groundwater Quality Investigation of St. Croix County, Wisconsin: Sample Numbers [plate 1]
1989
Map: 27 in x 20 in
-
Groundwater Quality Investigation of St. Croix County, Wisconsin: Nitrate-N in mg/L [plate 2]
1989
Map: 27 in x 20 in
-
Groundwater Quality Investigation of St. Croix County, Wisconsin: Chloride in mg/L [plate 3]
1989
Map: 27 in x 20 in
-
Groundwater Quality Investigation of St. Croix County, Wisconsin: Ferrous Iron in mg/L [plate 7]
1989
Map: 27 in x 20 in
-
-
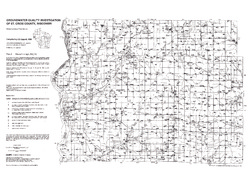
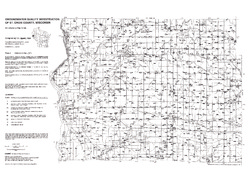
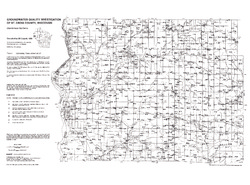
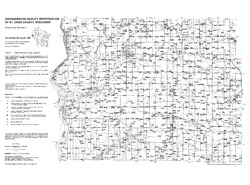
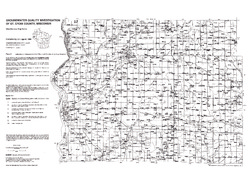
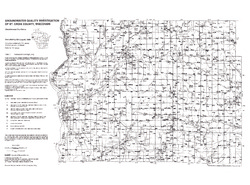
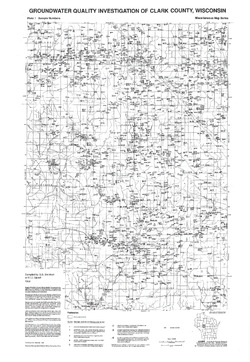
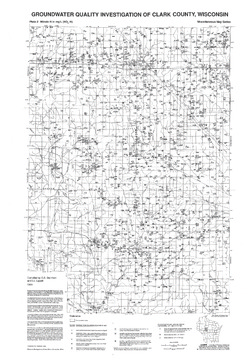
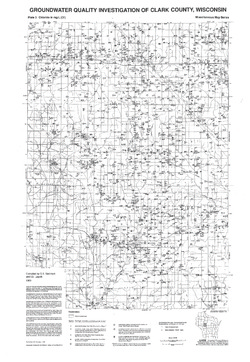
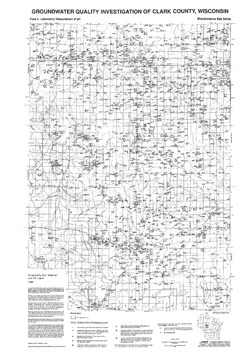
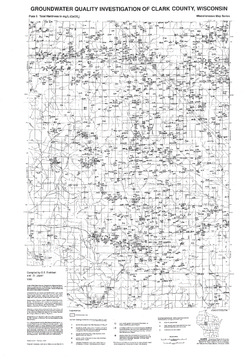
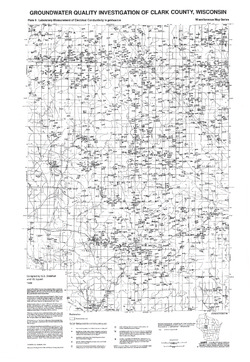
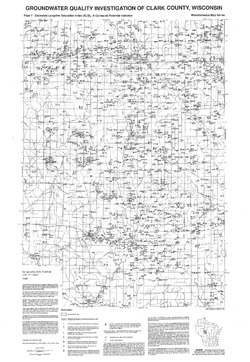
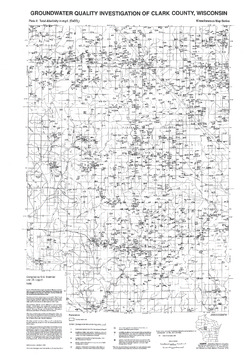
Groundwater Quality Investigation of Clark County, Wisconsin
Includes Plate 1: Sample Numbers; Plate 2: Nitrate-N in mg/L; Plate 3: Chloride in mg/L; Plate 4: Laboratory Measurement of pH; Plate 5: Total Hardness in mg/L; Plate 6: Laboratory Measurement of Electrical Conductivity in μmhos/cm; Plate 7: Estimated Langelier Saturation Index (ELSI); Plate 8: Total Alkalinity in mg/L.-
Groundwater Quality Investigation of Clark County, Wisconsin: Sample Numbers [plate 1]
1989
Map: 23.5 in x 34 in
-
Groundwater Quality Investigation of Clark County, Wisconsin: Nitrate-N in mg/L [plate 2]
1989
Map: 23.5 in x 34 in
-
Groundwater Quality Investigation of Clark County, Wisconsin: Chloride in mg/L [plate 3]
1989
Map: 23.5 in x 34 in
-
Groundwater Quality Investigation of Clark County, Wisconsin: Laboratory Measurement of pH [plate 4]
1989
Map: 23.5 in x 34 in
-
Groundwater Quality Investigation of Clark County, Wisconsin: Total Hardness in mg/L [plate 5]
1989
Map: 23.5 in x 34 in
-
Groundwater Quality Investigation of Clark County, Wisconsin: Total Alkalinity in mg/L [plate 8]
1989
Map: 23.5 in x 34 in
-

Publications Catalog
Wisconsin Geological and Natural History Survey