-
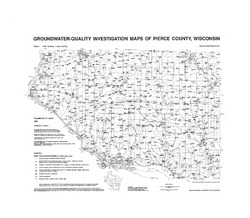
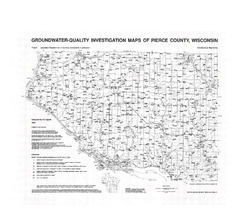
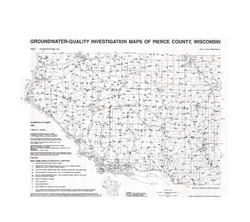
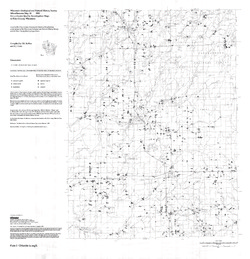
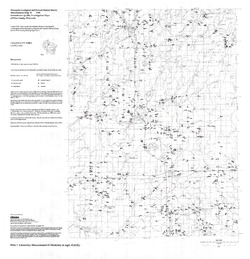
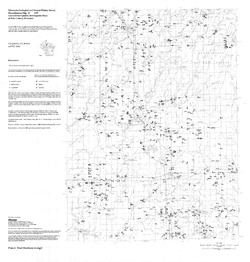
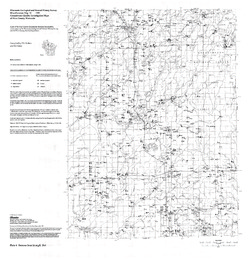
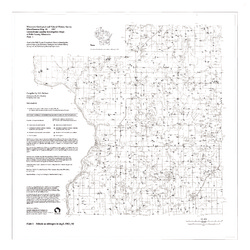
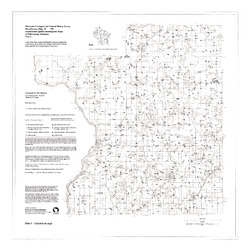
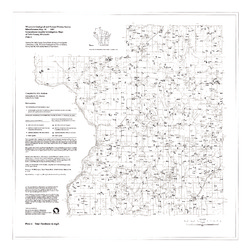
Groundwater-Quality Investigation Maps of Pierce County, Wisconsin
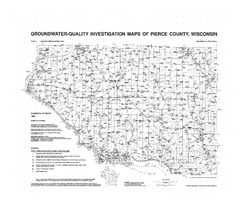
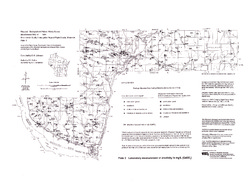
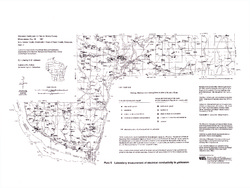
Includes Plate 1: Sample Numbers (map 90-3a). Plate 2: Nitrate as Nitrogen in mg/L (map 90-3b). Plate 3: Chloride in mg/L (map 90-3c). Plate 4: Laboratory Measurement of pH (map 90-3d). Plate 5: Total Hardness in mg/L (map 90-3e). Plate 6: Laboratory Measurement of Electrical Conductivity in μmhos/cm (map 90-3f). Plate 7: Ferrous Iron in mg/L (map 90-3g).-
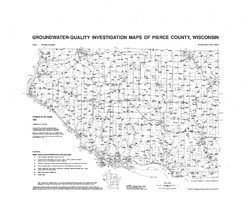
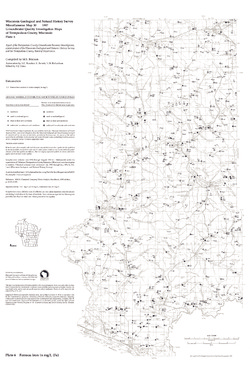
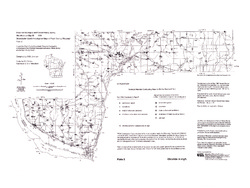
Groundwater-Quality Investigation Maps of Pierce County, Wisconsin: Sample Numbers [plate 1]
1990
Map: 27.5 in x 24 in
-
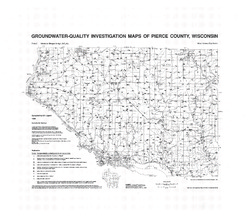
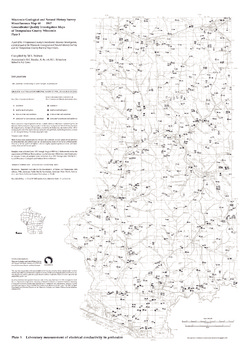
Groundwater-Quality Investigation Maps of Pierce County, Wisconsin: Chloride in mg/L [plate 3]
1990
Map: 27.5 in x 24 in
-
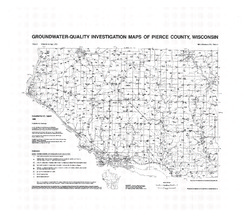
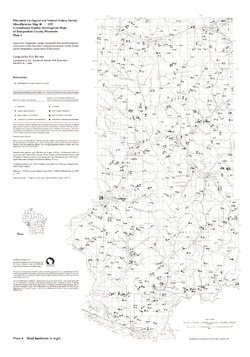
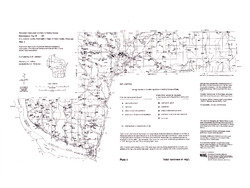
Groundwater-Quality Investigation Maps of Pierce County, Wisconsin: Total Hardness in mg/L [plate 5]
1990
Map: 27.5 in x 24 in
-
-
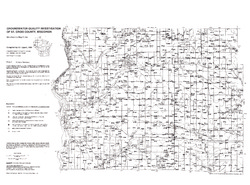
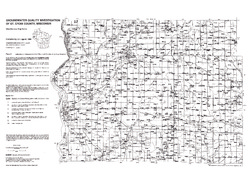
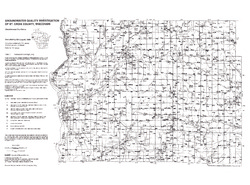
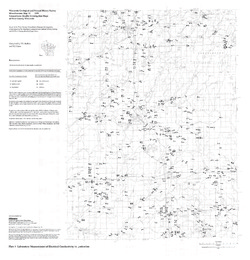
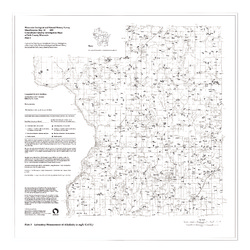
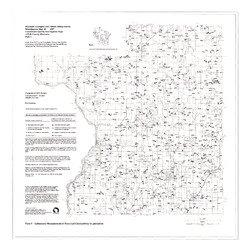
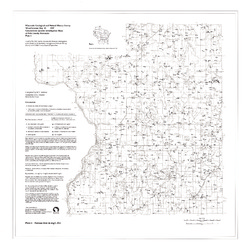
Groundwater Quality Investigation of St. Croix County, Wisconsin
Includes Plate 1: Sample Numbers (map 89-5a). Plate 2: Nitrate-N in mg/L (map 89-5b). Plate 3: Chloride in mg/L (map 89-5c). Plate 4: Laboratory Measurement of pH (map 89-5d). Plate 5: Total Hardness in mg/L (map 89-5e). Plate 6: Laboratory Measurement of Electrical Conductivity in μmhos/cm (map 89-5f). Plate 7: Ferrous Iron in mg/L (map 89-5g)....-
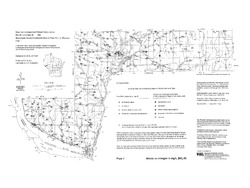
Groundwater Quality Investigation of St. Croix County, Wisconsin: Sample Numbers [plate 1]
1989
Map: 27 in x 20 in
-
Groundwater Quality Investigation of St. Croix County, Wisconsin: Nitrate-N in mg/L [plate 2]
1989
Map: 27 in x 20 in
-
Groundwater Quality Investigation of St. Croix County, Wisconsin: Chloride in mg/L [plate 3]
1989
Map: 27 in x 20 in
-
Groundwater Quality Investigation of St. Croix County, Wisconsin: Ferrous Iron in mg/L [plate 7]
1989
Map: 27 in x 20 in
-
-
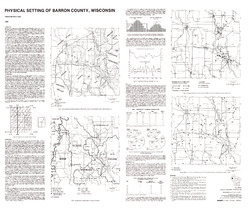
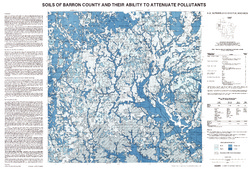
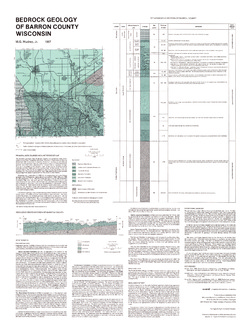
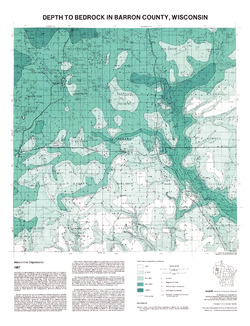
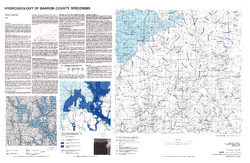
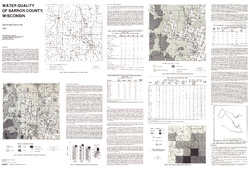
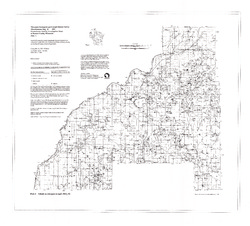
Atlas of Groundwater Resources and Geology of Barron County, Wisconsin
Includes Physical Setting; Soils of Barron County and Their Ability to Attenuate Pollutants; Bedrock Geology; Depth to Bedrock; Hydrogeology; Water Quality; Potential Sources of Groundwater Pollution; Groundwater Levels; Groundwater Pollution Potential.-
Atlas of Groundwater Resources and Geology of Barron County, Wisconsin: Soils of Barron County and Their Ability to Attenuate Pollutants
1987
Map: 30.8 in x 20.8 in, scale 1:100,000
-
Atlas of Groundwater Resources and Geology of Barron County, Wisconsin: Bedrock Geology of Barron County, Wisconsin
1987
Map: 21.5 in x 28.5 in, scale 1:250,000
-
Atlas of Groundwater Resources and Geology of Barron County, Wisconsin: Depth to Bedrock in Barron County, Wisconsin
1987
Map: 21.1 in x 27.6 in, scale 1:100,000
-
Atlas of Groundwater Resources and Geology of Barron County, Wisconsin: Hydrogeology of Barron County, Wisconsin
1987
Map: 37.5 in x 24.5 in, scale 1:100,000
-
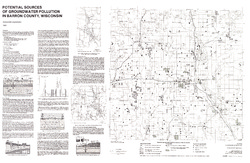
Atlas of Groundwater Resources and Geology of Barron County, Wisconsin: Potential Sources of Groundwater Pollution in Barron County, Wisconsin
1987
Map: 35.75 in x 23.3 in, scale 1:100,000
-
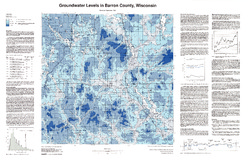
Atlas of Groundwater Resources and Geology of Barron County, Wisconsin: Groundwater Levels in Barron County, Wisconsin
1987
Map: 35.8 in x 23.3 in, scale 1:100,000
-
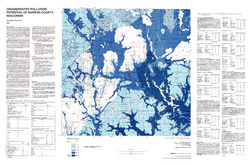
Atlas of Groundwater Resources and Geology of Barron County, Wisconsin: Groundwater Pollution Potential of Barron County, Wisconsin
1987
Map: 36.7 in x 24.25 in, scale 1:100,000
-
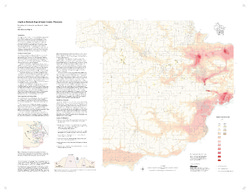
Groundwater Quality Investigation Maps of Buffalo County, Wisconsin
Includes Plate 1: Nitrate as Nitrogen in mg/L. Plate 2: Chloride in mg/L. Plate 3: Laboratory Measurement of Alkalinity in mg/L. Plate 4: Total Hardness in mg/L. Plate 5: Laboratory Measurement of Electrical Conductivity in μmhos/cm. Plate 6: Ferrous Iron in mg/L.-
Groundwater Quality Investigation Maps of Buffalo County, Wisconsin: Nitrate as Nitrogen in mg/L [plate 1]
2001
Map: 20 in x 30 in, scale 1:100,000
-
Groundwater Quality Investigation Maps of Buffalo County, Wisconsin: Chloride in mg/L [plate 2]
2001
Map: 20 in x 30 in, scale 1:100,000
-
Groundwater Quality Investigation Maps of Buffalo County, Wisconsin: Laboratory Measurement of Alkalinity in mg/L [plate 3]
2001
Map: 20 in x 30 in, scale 1:100,000
-
Groundwater Quality Investigation Maps of Buffalo County, Wisconsin: Total Hardness in mg/L [plate 4]
2001
Map: 19.7 in x 27.7 in, scale 1:100,000
-
Groundwater Quality Investigation Maps of Buffalo County, Wisconsin: Laboratory Measurement of Electrical Conductivity in μmhos/cm [plate 5]
2001
Map: 21 in x 30 in, scale 1:100,000
-
Groundwater Quality Investigation Maps of Buffalo County, Wisconsin: Ferrous Iron in mg/L [plate 6]
2001
Map: 20 in x 30 in, scale 1:100,000
-
-
Groundwater Quality Investigation Maps of Price County, Wisconsin
Includes Plate 1: Nitrate as Nitrogen in mg/L. Plate 2: Chloride in mg/L. Plate 3: Laboratory Measurement of Alkalinity in mg/L. Plate 4: Total Hardness in mg/L. Plate 5: Laboratory Measurement of Electrical Conductivity in μmhos/cm. Plate 6: Ferrous Iron in mg/L.-
Groundwater Quality Investigation Maps of Price County, Wisconsin: Nitrate as Nitrogen in mg/L [plate 1]
1999
Map: 29 in x 30 in, scale 1:100,000
-
Groundwater Quality Investigation Maps of Price County, Wisconsin: Chloride in mg/L [plate 2]
1999
Map: 29 in x 30 in, scale 1:100,000
-
Groundwater Quality Investigation Maps of Price County, Wisconsin: Laboratory Measurement of Alkalinity in mg/L [plate 3]
1999
Map: 29 in x 30 in, scale 1:100,000
-
Groundwater Quality Investigation Maps of Price County, Wisconsin: Total Hardness in mg/L [plate 4]
1999
Map: 28.7 in x 30 in, scale 1:100,000
-
Groundwater Quality Investigation Maps of Price County, Wisconsin: Laboratory Measurement of Electrical Conductivity in μmhos/cm [plate 5]
1999
Map: 28.9 in x 30 in, scale 1:100,000
-
Groundwater Quality Investigation Maps of Price County, Wisconsin: Ferrous Iron in mg/L [plate 6]
1999
Map: 29 in x 30 in, scale 1:100,000
-
-
Groundwater Quality Investigation Maps of Polk County, Wisconsin
Includes Plate 1: Nitrate as Nitrogen in mg/L. Plate 2: Chloride in mg/L. Plate 3: Laboratory Measurement of Alkalinity in mg/L. Plate 4: Total Hardness in mg/L. Plate 5: Laboratory Measurement of Electrical Conductivity in μmhos/cm. Plate 6: Ferrous Iron in mg/L.-
Groundwater Quality Investigation Maps of Polk County, Wisconsin: Nitrate as Nitrogen in mg/L [plate 1]
1997
Map: 30 in x 30 in, scale 1:100,000
-
Groundwater Quality Investigation Maps of Polk County, Wisconsin: Chloride in mg/L [plate 2]
1997
Map: 30 in x 30 in, scale 1:100,000
-
Groundwater Quality Investigation Maps of Polk County, Wisconsin: Laboratory Measurement of Alkalinity in mg/L [plate 3]
1997
Map: 30 in x 30 in, scale 1:100,000
-
Groundwater Quality Investigation Maps of Polk County, Wisconsin: Total Hardness in mg/L [plate 4]
1997
Map: 30 in x 30 in, scale 1:100,000
-
Groundwater Quality Investigation Maps of Polk County, Wisconsin: Laboratory Measurement of Electrical Conductivity in μmhos/cm [plate 5]
1997
Map: 30 in x 30 in, scale 1:100,000
-
Groundwater Quality Investigation Maps of Polk County, Wisconsin: Ferrous Iron in mg/L [plate 6]
1997
Map: 30 in x 30 in, scale 1:100,000
-
-
Groundwater Quality Investigation Maps of Burnett County, Wisconsin
-
Groundwater Quality Investigation Maps of Burnett County, Wisconsin: Nitrate as Nitrogen in mg/L [plate 1]
1997
Map: 35.2 in x 31.8 in, scale 1:100,000
-
Groundwater Quality Investigation Maps of Burnett County, Wisconsin: Chloride in mg/L [plate 2]
1997
Map: 34.8 in x 31.3 in, scale 1:100,000
-
Groundwater Quality Investigation Maps of Burnett County, Wisconsin: Laboratory Measurement of Alkalinity in mg/L [plate 3]
1997
Map: 34.7 in x 31.3 in, scale 1:100,000
-
Groundwater Quality Investigation Maps of Burnett County, Wisconsin: Total Hardness in mg/L [plate 4]
1997
Map: 35.2 in x 31.7 in, scale 1:100,000
-
Groundwater Quality Investigation Maps of Burnett County, Wisconsin: Laboratory Measurement of Electrical Conductivity in μmhos/cm [plate 5]
1997
Map: 35.5 in x 32 in, scale 1:100,000
-
Groundwater Quality Investigation Maps of Burnett County, Wisconsin: Ferrous Iron in mg/L [plate 6]
1997
Map: 35.5 in x 32 in, scale 1:100,000
-
-
Groundwater Quality Investigation Maps of Trempealeau County, Wisconsin
Includes Plate 1: Nitrate as Nitrogen in mg/L. Plate 2: Chloride in mg/L. Plate 3: Laboratory Measurement of Alkalinity in mg/L. Plate 4: Total Hardness in mg/L. Plate 5: Laboratory Measurement of Electrical Conductivity in μmhos/cm. Plate 6: Ferrous Iron in mg/L.-
Groundwater Quality Investigation Maps of Trempealeau County, Wisconsin: Nitrate as Nitrogen in mg/L [plate 1]
1997
Map: 21 in x 30 in, scale 1:100,000
-
Groundwater Quality Investigation Maps of Trempealeau County, Wisconsin: Chloride in mg/L [plate 2]
1997
Map: 21 in x 30 in, scale 1:100,000
-
Groundwater Quality Investigation Maps of Trempealeau County, Wisconsin: Laboratory Measurement of Alkalinity in mg/L [plate 3]
1997
Map: 21 in x 30 in, scale 1:100,000
-
Groundwater Quality Investigation Maps of Trempealeau County, Wisconsin: Total Hardness in mg/L [plate 4]
1997
Map: 21 in x 30 in, scale 1:100,000
-
Groundwater Quality Investigation Maps of Trempealeau County, Wisconsin: Laboratory Measurement of Electrical Conductivity in μmhos/cm [plate 5]
1997
Map: 21 in x 30 in, scale 1:100,000
-
Groundwater Quality Investigation Maps of Trempealeau County, Wisconsin: Ferrous Iron in mg/L [plate 6]
1997
Map: 20 in x 30 in, scale 1:100,000
-
-
Groundwater Quality Investigation Maps of Pepin County, Wisconsin
Includes Plate 1: Nitrate as Nitrogen in mg/L. Plate 2: Chloride in mg/L. Plate 3: Laboratory Measurement of Alkalinity in mg/L. Plate 4: Total Hardness in mg/L. Plate 5: Laboratory Measurement of Electrical Conductivity in μmhos/cm. Plate 6: Ferrous Iron in mg/L.-
Groundwater Quality Investigation Maps of Pepin County, Wisconsin: Nitrate as Nitrogen in mg/L [plate 1]
1994
Map: 24 in x 18 in, scale 1:100,000
-
Groundwater Quality Investigation Maps of Pepin County, Wisconsin: Chloride in mg/L [plate 2]
1994
Map: 24 in x 18 in, scale 1:100,000
-
Groundwater Quality Investigation Maps of Pepin County, Wisconsin: Laboratory Measurement of Alkalinity in mg/L [plate 3]
1994
Map: 24 in x 18 in, scale 1:100,000
-
Groundwater Quality Investigation Maps of Pepin County, Wisconsin: Total Hardness in mg/L [plate 4]
1994
Map: 24 in x 18 in, scale 1:100,000
-
Groundwater Quality Investigation Maps of Pepin County, Wisconsin: Laboratory Measurement of Electrical Conductivity in μmhos/cm [plate 5]
1994
Map: 24 in x 18 in, scale 1:100,000
-
Groundwater Quality Investigation Maps of Pepin County, Wisconsin: Ferrous Iron in mg/L [plate 6]
1994
Map: 23.7 in x 17.6 in, scale 1:100,000
-
-
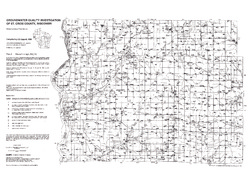
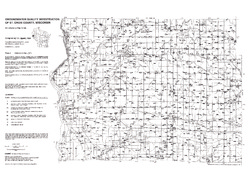
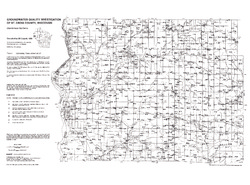
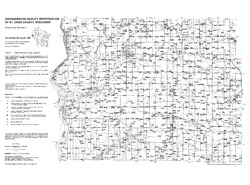
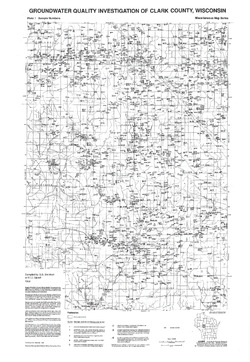
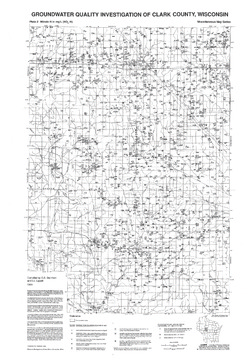
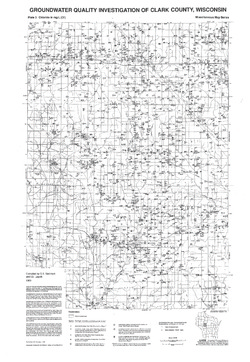
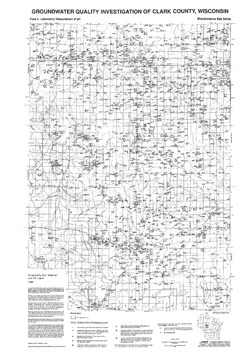
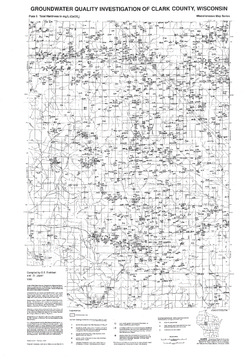
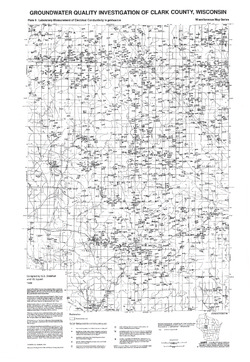
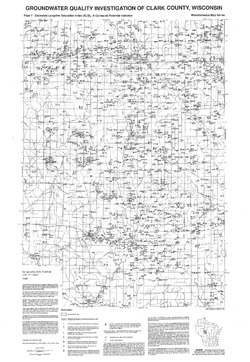
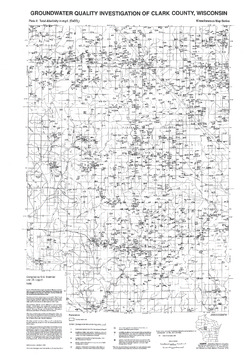
Groundwater Quality Investigation of Clark County, Wisconsin
Includes Plate 1: Sample Numbers; Plate 2: Nitrate-N in mg/L; Plate 3: Chloride in mg/L; Plate 4: Laboratory Measurement of pH; Plate 5: Total Hardness in mg/L; Plate 6: Laboratory Measurement of Electrical Conductivity in μmhos/cm; Plate 7: Estimated Langelier Saturation Index (ELSI); Plate 8: Total Alkalinity in mg/L.-
Groundwater Quality Investigation of Clark County, Wisconsin: Sample Numbers [plate 1]
1989
Map: 23.5 in x 34 in
-
Groundwater Quality Investigation of Clark County, Wisconsin: Nitrate-N in mg/L [plate 2]
1989
Map: 23.5 in x 34 in
-
Groundwater Quality Investigation of Clark County, Wisconsin: Chloride in mg/L [plate 3]
1989
Map: 23.5 in x 34 in
-
Groundwater Quality Investigation of Clark County, Wisconsin: Laboratory Measurement of pH [plate 4]
1989
Map: 23.5 in x 34 in
-
Groundwater Quality Investigation of Clark County, Wisconsin: Total Hardness in mg/L [plate 5]
1989
Map: 23.5 in x 34 in
-
Groundwater Quality Investigation of Clark County, Wisconsin: Total Alkalinity in mg/L [plate 8]
1989
Map: 23.5 in x 34 in
-
-
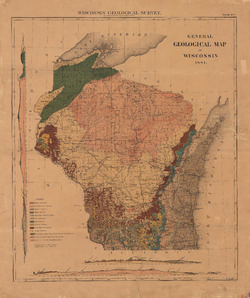
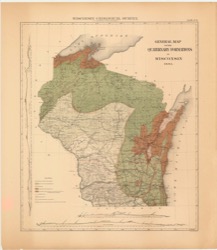
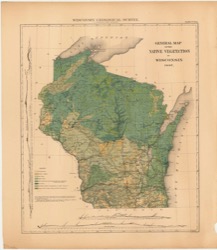
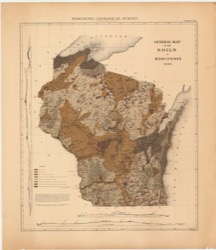
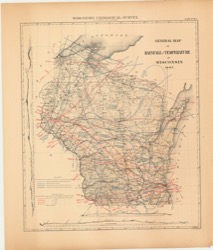
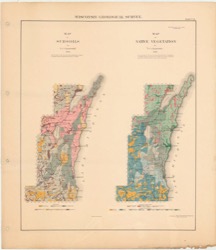
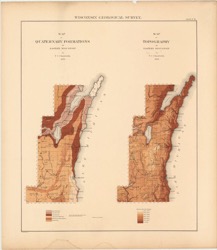
Atlas of the Geological Survey of Wisconsin
Collection of most of the plates accompanying Chamberlin's four-volume Geology of Wisconsin: Survey of 1873-1879.-
Atlas of the Geological Survey of Wisconsin: General Geological Map of Wisconsin [plate 1]
1882
Map: 25.5 in x 30.3 in, scale 1 in = 15 miles
-
Atlas of the Geological Survey of Wisconsin: General Map of Quaternary Formations [plate 2]
1882
Map: 28.2 in x 32.4 in
-
Atlas of the Geological Survey of Wisconsin: General Map of Native Vegetation [plate 2A]
1882
Map: 28.2 in x 32.4 in
-
Atlas of the Geological Survey of Wisconsin: General Map of Soils [plate 2B]
1882
Map: 28.2 in x 32.5 in
-
Atlas of the Geological Survey of Wisconsin: Map of Rainfall and Temperature [plate 2C]
1882
Map: 27.7 in x 32.5 in
-
Atlas of the Geological Survey of Wisconsin: Maps of Subsoils and Native Vegetation of Eastern Wisconsin [plate 3]
1877
Map: 27.82 in x 32.17 in, scale 1 in = 12 miles
-
Atlas of the Geological Survey of Wisconsin: Maps of Topography and Quaternary Formations of Eastern Wisconsin [plate 4]
1877
Map: 27.83 in x 32.06 in, scale 1 in = 12 miles
-
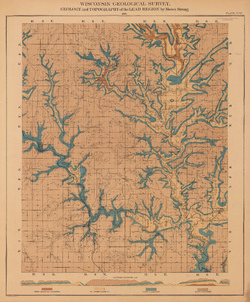
Atlas of the Geological Survey of Wisconsin: Geology and Topography of the Lead Region [plate 5]
1877
Map: 27.68 in x 32.18 in
-
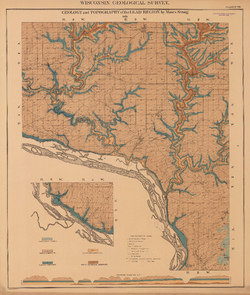
Atlas of the Geological Survey of Wisconsin: Geology and Topography of the Lead Region [plate 6]
1877
Map: 23.98 in x 28.94 in
-
Atlas of the Geological Survey of Wisconsin: Geology and Topography of the Lead Region [plate 8]
1877
Map: 24.03 in x 28.38 in
- 32 more...
-
-
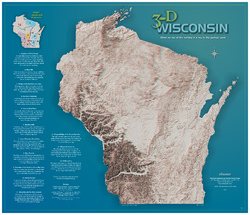
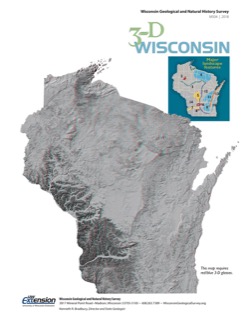
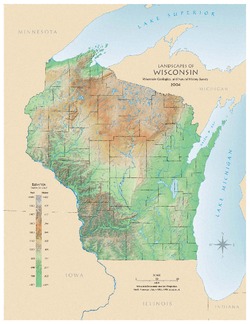
3-D Wisconsin
When viewed with 3-D glasses, Wisconsin’s land features pop off the page. Brief descriptions of major land forms paint the geologic history that shaped the state; expanded descriptions and photos are online. We’ve field-tested this map on fourth graders and can attest to its appeal. Sizes: 27.5 x 32 inches, 8.5 x 11 inches. Requires red-blue 3-D glasses. -
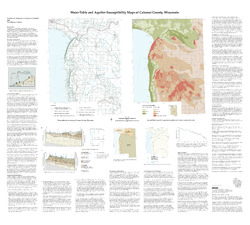
Water-Table and Aquifer Susceptibility Maps of Calumet County, Wisconsin
-
Water-Table and Aquifer-Susceptibility Maps of Calumet County, Wisconsin
2006
Map: 40.3 in x 36.3 in, scale 1:100,000
-
Water-Table and Aquifer-Susceptibility Maps of Calumet County, Wisconsin [GIS data]
2006
Map: Coverage (.e00 file format)
-
-
Water-Table Elevation Map of Sauk County, Wisconsin
-
Water-Table Elevation Map of Sauk County, Wisconsin [GIS data]
2002
Map: Coverage (.e00 file format)
-
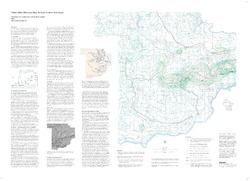
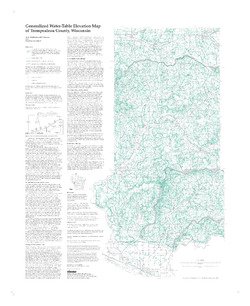
Generalized Water-Table Elevation Map of Trempealeau County, Wisconsin
-
Generalized Water-Table Elevation Map of Trempealeau County, Wisconsin
1998
Map: 27 in x 33 in, scale 1:100,000
-
Generalized Water-Table Elevation Map of Trempealeau County, Wisconsin" [GIS data]
1998
Map: Coverage (.e00 file format)
-
-
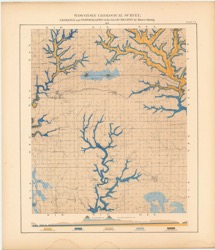
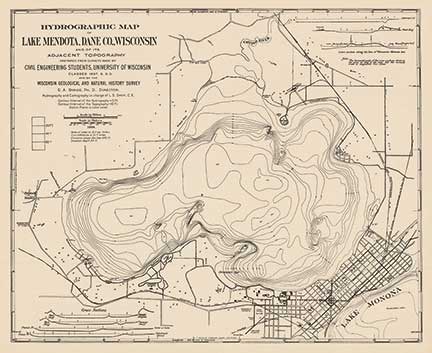
Hydrographic Map of Lake Mendota, Dane County, Wisconsin, and of Its Adjacent Topography
-
Hydrographic Map of Lake Mendota, Dane County, Wisconsin, and of Its Adjacent Topography
1900
Map: 24.9 in x 20.3 in, scale 1 in = 1/3 mile
-
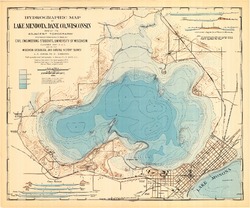
Hydrographic Map of Lake Mendota, Dane County, Wisconsin, and of Its Adjacent Topography
1900
Map: 24.9 in x 20.7 in, scale 1 in = 1/3 mile
-
-
Industrial Sand Potential in Wisconsin: Sandstone at or near the Surface
Shows where sandstone can be found within 100 ft (30 m) of the surface.-
Industrial Sand Potential in Wisconsin: Sandstone at or Near the Surface
2013
Map: 21 in x 22.5 in, scale 1:1,000,000
-
-
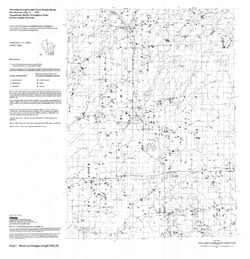
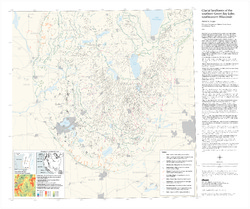
Glacial Landforms of the Southern Green Bay Lobe, Southeastern Wisconsin
Shows the features (such as drumlins, moraines, and eskers) created by the southern Green Bay Lobe of the Laurentide Ice Sheet in southeastern Wisconsin.-
Glacial Landforms of the Southern Green Bay Lobe, Southeastern Wisconsin
2003
Map: 35 in x 30 in, scale 1:250,000
-

Publications Catalog
Wisconsin Geological and Natural History Survey